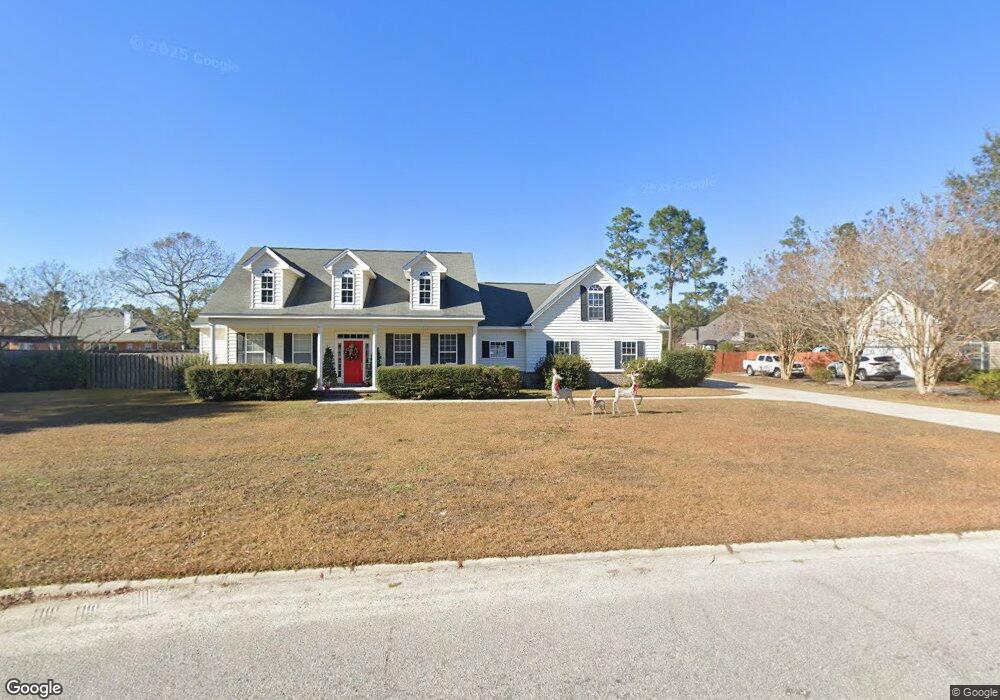
307 Saint Johns Rd Guyton, GA 31312
Estimated Value: $395,350 - $450,000
Studio
1
Bath
2,572
Sq Ft
$169/Sq Ft
Est. Value
About This Home
This home is located at 307 Saint Johns Rd, Guyton, GA 31312 and is currently estimated at $434,088, approximately $168 per square foot. 307 Saint Johns Rd is a home located in Effingham County with nearby schools including Marlow Elementary School, South Effingham Middle School, and South Effingham High School.
Ownership History
Date
Name
Owned For
Owner Type
Purchase Details
Closed on
Jan 15, 2009
Sold by
Lariscy Jennifer Michel
Bought by
Lariscy Chad Benjamin
Current Estimated Value
Home Financials for this Owner
Home Financials are based on the most recent Mortgage that was taken out on this home.
Original Mortgage
$282,000
Outstanding Balance
$177,265
Interest Rate
5.24%
Mortgage Type
New Conventional
Estimated Equity
$256,823
Purchase Details
Closed on
Sep 29, 2005
Sold by
Federal National Mortgage Association
Bought by
Lariscy Chad Benjamin and Lariscy Jennifer Michael
Home Financials for this Owner
Home Financials are based on the most recent Mortgage that was taken out on this home.
Original Mortgage
$269,000
Interest Rate
5.88%
Mortgage Type
New Conventional
Purchase Details
Closed on
Jun 7, 2005
Sold by
Mtg Electronic Registratio
Bought by
Federal National Mtg Associati
Create a Home Valuation Report for This Property
The Home Valuation Report is an in-depth analysis detailing your home's value as well as a comparison with similar homes in the area
Home Values in the Area
Average Home Value in this Area
Purchase History
| Date | Buyer | Sale Price | Title Company |
|---|---|---|---|
| Lariscy Chad Benjamin | -- | -- | |
| Lariscy Chad Benjamin | $269,000 | -- | |
| Federal National Mtg Associati | -- | -- | |
| Mtg Electronic Registration Sy | -- | -- |
Source: Public Records
Mortgage History
| Date | Status | Borrower | Loan Amount |
|---|---|---|---|
| Open | Lariscy Chad Benjamin | $282,000 | |
| Closed | Lariscy Chad Benjamin | $269,000 |
Source: Public Records
Tax History
| Year | Tax Paid | Tax Assessment Tax Assessment Total Assessment is a certain percentage of the fair market value that is determined by local assessors to be the total taxable value of land and additions on the property. | Land | Improvement |
|---|---|---|---|---|
| 2025 | $4,418 | $142,633 | $30,000 | $112,633 |
| 2024 | $4,089 | $152,363 | $30,000 | $122,363 |
| 2023 | $3,999 | $148,285 | $20,800 | $127,485 |
| 2022 | $118 | $126,716 | $18,800 | $107,916 |
| 2021 | $3,532 | $113,226 | $16,000 | $97,226 |
| 2020 | $3,204 | $102,855 | $16,000 | $86,855 |
| 2019 | $3,223 | $102,855 | $16,000 | $86,855 |
| 2018 | $3,199 | $100,461 | $16,000 | $84,461 |
| 2017 | $3,290 | $102,461 | $18,000 | $84,461 |
| 2016 | $3,101 | $101,036 | $18,000 | $83,036 |
| 2015 | -- | $101,036 | $18,000 | $83,036 |
| 2014 | -- | $99,236 | $16,200 | $83,036 |
| 2013 | -- | $86,996 | $3,960 | $83,036 |
Source: Public Records
Map
Nearby Homes
- 206 Saint Pauls Rd
- 118 Brittany Ln
- 111 St Matthews
- 1208 Nease Rd
- 101 Brittany Ln
- 187 Meadowood Ln
- 110 S Effingham Plantation Dr
- 161 S Effingham Plantation Dr
- 122 S Effingham Plantation Dr
- 139 S Effingham Plantation Dr
- 181 Old Lake Rd
- 633 Majestic Dr
- 675 Majestic Dr
- 679 Majestic Dr
- 681 Majestic Dr
- 114 Little Ben Ct
- 108 Little Ben Ct
- 214 Wessex Rd
- 167 Buckeye Rd
- 163 Buckeye Rd
- 309 Saint Johns Rd
- 305 Saint Johns Rd
- 208 St Pauls Rd
- 208 Saint Pauls Rd
- 210 Saint Pauls Rd
- 303 St Johns Rd
- 306 Saint Johns Rd
- 303 Saint Johns Rd
- 303 Saint Johns Rd Unit 42
- 308 Saint Johns Rd
- 311 Saint Johns Rd
- 212 Saint Pauls Rd
- 310 Saint Johns Rd
- 304 Saint Johns Rd
- 313 Saint Johns Rd
- 106 Saint Matthews Rd
- 214 Saint Pauls Rd
- 312 Saint Johns Rd
- 108 Saint Matthews Rd
- 213 S Paul's Rd
Your Personal Tour Guide
Ask me questions while you tour the home.