Estimated Value: $158,000 - $166,000
3
Beds
1
Bath
960
Sq Ft
$169/Sq Ft
Est. Value
About This Home
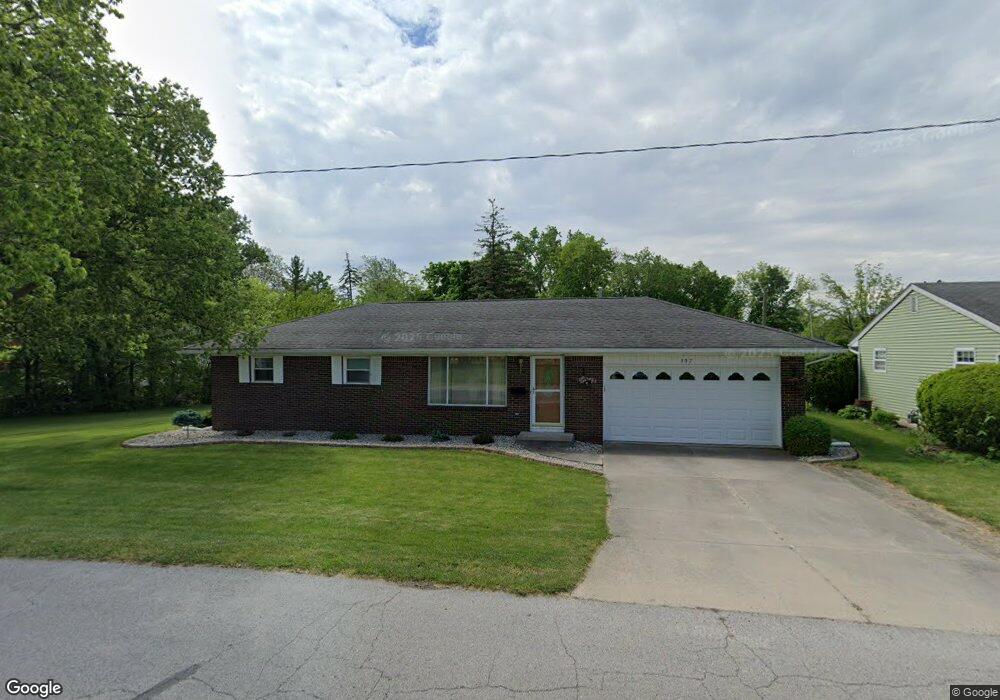
This home is located at 307 W 10th St, Genoa, OH 43430 and is currently estimated at $161,867, approximately $168 per square foot. 307 W 10th St is a home located in Ottawa County with nearby schools including Genoa Elementary School.
Ownership History
Date
Name
Owned For
Owner Type
Purchase Details
Closed on
Apr 29, 2013
Sold by
Reimer Edward A and Reimer Gary H
Bought by
B & H Homestead Llc
Current Estimated Value
Purchase Details
Closed on
Oct 27, 2008
Sold by
Reimer Gary H and Reimer Kelly J
Bought by
Reimer Gary H and Reimer Kelly J
Purchase Details
Closed on
Apr 11, 2007
Sold by
Reimer Gary H
Bought by
Langschied Gerald L and Langschied Helen L
Purchase Details
Closed on
Apr 7, 2007
Sold by
Reimer Edward A
Bought by
Langschied Gerald L and Langschied Helen L
Purchase Details
Closed on
Dec 1, 2003
Sold by
Sargent Helen N
Bought by
Langschied Et Al Gerald
Purchase Details
Closed on
May 29, 1992
Sold by
Sargent Ronald E
Bought by
Sargent Ronald E and Sargent Helen N S
Create a Home Valuation Report for This Property
The Home Valuation Report is an in-depth analysis detailing your home's value as well as a comparison with similar homes in the area
Home Values in the Area
Average Home Value in this Area
Purchase History
| Date | Buyer | Sale Price | Title Company |
|---|---|---|---|
| B & H Homestead Llc | -- | Attorney | |
| Reimer Gary H | -- | Attorney | |
| Langschied Gerald L | -- | Attorney | |
| Reimer Gary H | -- | Attorney | |
| Langschied Gerald L | -- | Attorney | |
| Langschied Et Al Gerald | $100,000 | -- | |
| Sargent Ronald E | -- | -- |
Source: Public Records
Tax History Compared to Growth
Tax History
| Year | Tax Paid | Tax Assessment Tax Assessment Total Assessment is a certain percentage of the fair market value that is determined by local assessors to be the total taxable value of land and additions on the property. | Land | Improvement |
|---|---|---|---|---|
| 2024 | $1,789 | $39,936 | $8,208 | $31,728 |
| 2023 | $1,789 | $36,117 | $6,843 | $29,274 |
| 2022 | $1,785 | $36,117 | $6,843 | $29,274 |
| 2021 | $1,567 | $36,110 | $6,840 | $29,270 |
| 2020 | $1,344 | $29,120 | $4,720 | $24,400 |
| 2019 | $1,335 | $29,120 | $4,720 | $24,400 |
| 2018 | $1,305 | $29,120 | $4,720 | $24,400 |
| 2017 | $1,378 | $28,750 | $4,720 | $24,030 |
| 2016 | $1,383 | $28,750 | $4,720 | $24,030 |
| 2015 | $1,392 | $28,750 | $4,720 | $24,030 |
| 2014 | $935 | $25,450 | $4,720 | $20,730 |
| 2013 | $935 | $25,450 | $4,720 | $20,730 |
Source: Public Records
Map
Nearby Homes
- 904 Main St
- 1350 N Genoa Clay Center Rd
- 207 E 11th St
- 1301 West St
- 514 West St
- 510 Wilson St
- 416 Castle Cove
- 22771 W Holt Harrigan Rd
- 1615 N Thyre Dr
- 23225 Ohio 51
- 23430 State Route 51 W
- 1861 N Opfer-Lentz Rd
- 0 Recker Rd
- 19383 Courtland Ave
- 24764 Bradner Rd
- 1251 S Railroad St
- 20240 W Portage River South Rd
- 0 Circle Dr Unit 6133022
- 219 Lime St
- 612 W Main St