Estimated Value: $467,734 - $556,000
3
Beds
1
Bath
1,232
Sq Ft
$416/Sq Ft
Est. Value
About This Home
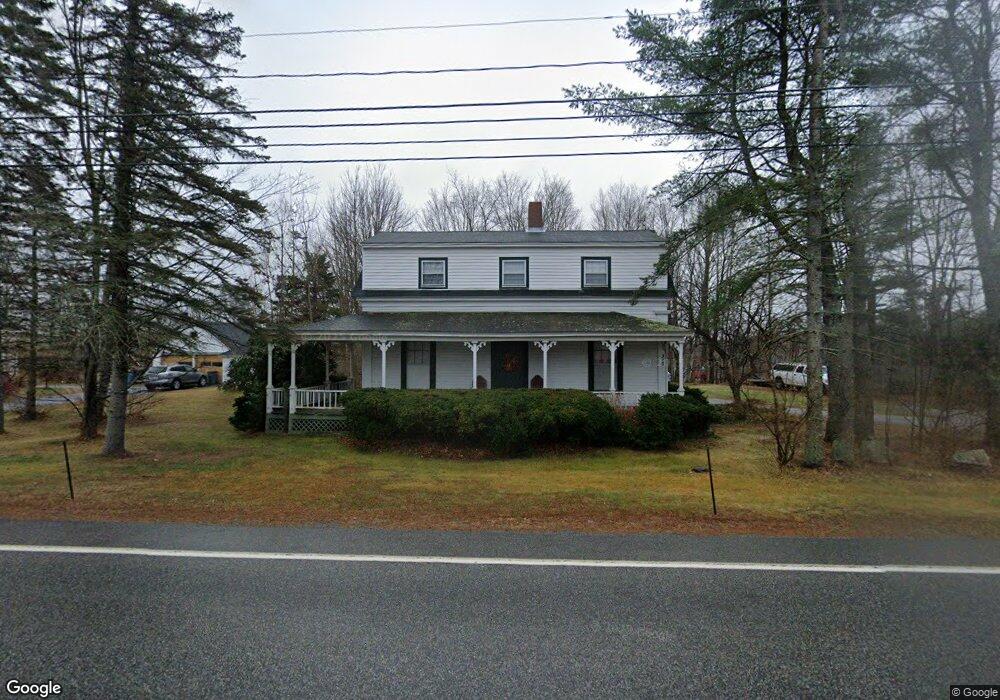
This home is located at 307 W Gray Rd, Gray, ME 04039 and is currently estimated at $512,934, approximately $416 per square foot. 307 W Gray Rd is a home located in Cumberland County with nearby schools including Gray-New Gloucester High School and Fiddlehead School of Arts & Science.
Ownership History
Date
Name
Owned For
Owner Type
Purchase Details
Closed on
Jan 9, 2017
Sold by
Boulanger Jeffrey J
Bought by
Boulanger Jeffrey J and Boulanger Lorraine A
Current Estimated Value
Home Financials for this Owner
Home Financials are based on the most recent Mortgage that was taken out on this home.
Original Mortgage
$181,000
Interest Rate
4.03%
Mortgage Type
Unknown
Purchase Details
Closed on
May 12, 2014
Sold by
Boulanger Shirley L
Bought by
Boulanger Jeffrey J
Create a Home Valuation Report for This Property
The Home Valuation Report is an in-depth analysis detailing your home's value as well as a comparison with similar homes in the area
Home Values in the Area
Average Home Value in this Area
Purchase History
| Date | Buyer | Sale Price | Title Company |
|---|---|---|---|
| Boulanger Jeffrey J | -- | -- | |
| Boulanger Jeffrey J | -- | -- |
Source: Public Records
Mortgage History
| Date | Status | Borrower | Loan Amount |
|---|---|---|---|
| Closed | Boulanger Jeffrey J | $181,000 |
Source: Public Records
Tax History
| Year | Tax Paid | Tax Assessment Tax Assessment Total Assessment is a certain percentage of the fair market value that is determined by local assessors to be the total taxable value of land and additions on the property. | Land | Improvement |
|---|---|---|---|---|
| 2025 | $4,482 | $463,000 | $120,000 | $343,000 |
| 2024 | $4,491 | $463,000 | $120,000 | $343,000 |
| 2023 | $4,354 | $286,800 | $60,100 | $226,700 |
| 2022 | $4,001 | $286,800 | $60,100 | $226,700 |
| 2021 | $3,898 | $266,800 | $60,100 | $206,700 |
| 2020 | $3,935 | $266,800 | $60,100 | $206,700 |
| 2019 | $3,935 | $266,800 | $60,100 | $206,700 |
| 2018 | $3,735 | $266,800 | $60,100 | $206,700 |
| 2017 | $3,778 | $209,300 | $47,100 | $162,200 |
| 2016 | $3,830 | $209,300 | $47,100 | $162,200 |
| 2015 | $3,809 | $209,300 | $47,100 | $162,200 |
| 2014 | $3,809 | $209,300 | $47,100 | $162,200 |
| 2012 | $3,003 | $189,455 | $47,060 | $142,395 |
Source: Public Records
Map
Nearby Homes
- 11 Dragonfly Dr
- 4 Wheeler Rd
- 107 W Gray Rd
- 7 Baxter Woods Trail
- 30 Motorcycle Dr
- 219 Tandberg Trail
- 34 Many Oaks Ln
- 9 Aerie Dr
- 66 James Way
- 1,8 Sugar Maple Rd
- 8 Emerson Dr
- 000 Falmouth Rd
- 14 Emerson Dr
- 15 Worcester Dr
- 13 Yarmouth Rd
- 14 Sabbady Point Rd
- 2 Aerie Dr
- 127 Shaker Rd Unit 17
- 22 Gray Park
- 5 Sandbar Rd
Your Personal Tour Guide
Ask me questions while you tour the home.