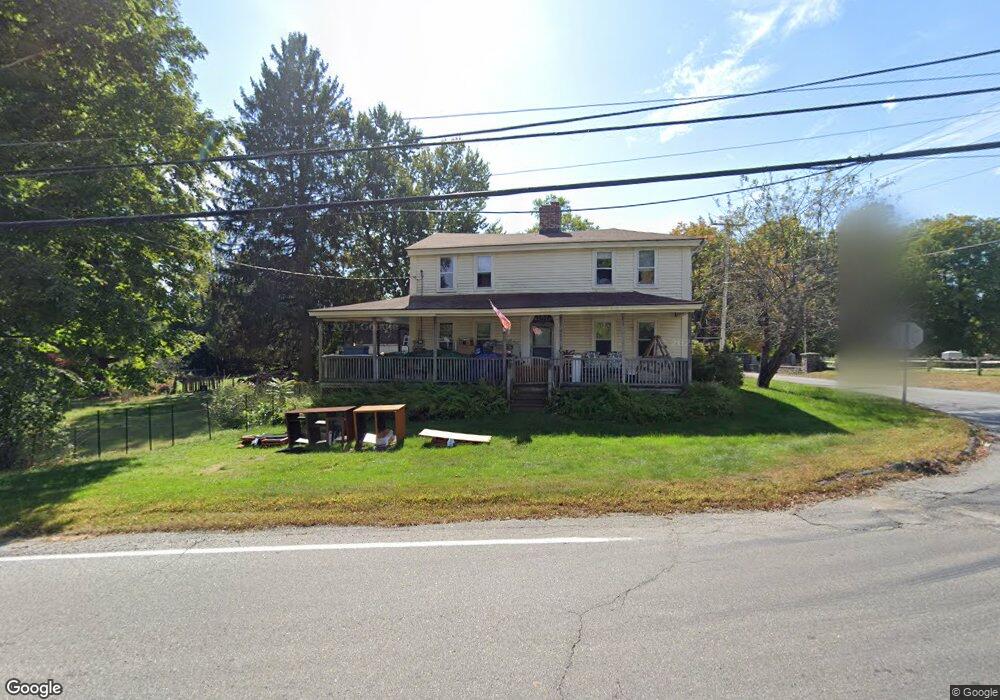
307 W Main St Millbury, MA 01527
Estimated Value: $437,000 - $679,000
3
Beds
2
Baths
2,331
Sq Ft
$249/Sq Ft
Est. Value
About This Home
This home is located at 307 W Main St, Millbury, MA 01527 and is currently estimated at $580,191, approximately $248 per square foot. 307 W Main St is a home located in Worcester County with nearby schools including Elmwood Street Elementary School, Raymond E. Shaw Elementary School, and Millbury Junior/Senior High School.
Ownership History
Date
Name
Owned For
Owner Type
Purchase Details
Closed on
Dec 11, 2009
Sold by
Barrett Linda G
Bought by
Wong Christopher D
Current Estimated Value
Home Financials for this Owner
Home Financials are based on the most recent Mortgage that was taken out on this home.
Original Mortgage
$218,469
Outstanding Balance
$145,036
Interest Rate
5.25%
Mortgage Type
FHA
Estimated Equity
$435,155
Purchase Details
Closed on
May 18, 1987
Sold by
Lincoln Alan D
Bought by
Barrett Paul
Home Financials for this Owner
Home Financials are based on the most recent Mortgage that was taken out on this home.
Original Mortgage
$143,000
Interest Rate
9.31%
Mortgage Type
Purchase Money Mortgage
Create a Home Valuation Report for This Property
The Home Valuation Report is an in-depth analysis detailing your home's value as well as a comparison with similar homes in the area
Home Values in the Area
Average Home Value in this Area
Purchase History
| Date | Buyer | Sale Price | Title Company |
|---|---|---|---|
| Wong Christopher D | $222,500 | -- | |
| Barrett Paul | $159,000 | -- |
Source: Public Records
Mortgage History
| Date | Status | Borrower | Loan Amount |
|---|---|---|---|
| Open | Wong Christopher D | $218,469 | |
| Previous Owner | Barrett Paul | $112,000 | |
| Previous Owner | Barrett Paul | $137,500 | |
| Previous Owner | Barrett Paul | $143,000 |
Source: Public Records
Tax History Compared to Growth
Tax History
| Year | Tax Paid | Tax Assessment Tax Assessment Total Assessment is a certain percentage of the fair market value that is determined by local assessors to be the total taxable value of land and additions on the property. | Land | Improvement |
|---|---|---|---|---|
| 2025 | $5,770 | $430,900 | $124,000 | $306,900 |
| 2024 | $5,301 | $400,700 | $114,700 | $286,000 |
| 2023 | $4,740 | $328,000 | $80,200 | $247,800 |
| 2022 | $4,526 | $301,700 | $80,200 | $221,500 |
| 2021 | $141 | $292,900 | $80,200 | $212,700 |
| 2020 | $10,731 | $280,600 | $80,200 | $200,400 |
| 2019 | $4,471 | $282,100 | $72,900 | $209,200 |
| 2018 | $9,782 | $245,200 | $72,900 | $172,300 |
| 2017 | $128 | $233,000 | $72,900 | $160,100 |
| 2016 | $3,638 | $221,000 | $72,900 | $148,100 |
| 2015 | $3,608 | $219,200 | $77,600 | $141,600 |
| 2014 | $3,343 | $195,500 | $77,600 | $117,900 |
Source: Public Records
Map
Nearby Homes