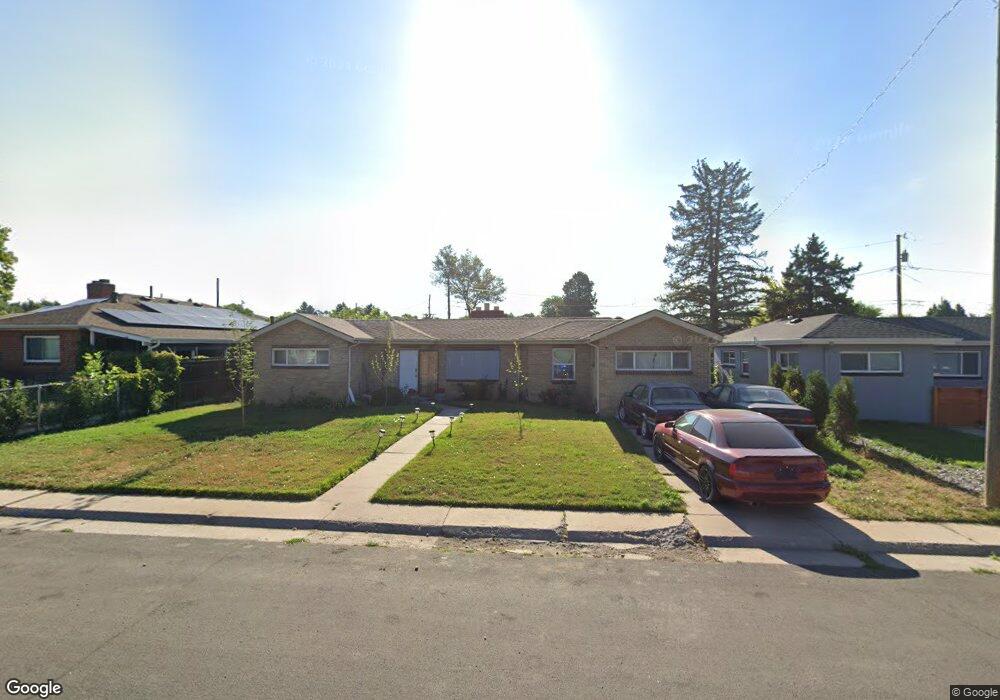
3070 Garfield St Denver, CO 80205
Skyland NeighborhoodEstimated Value: $501,000 - $570,000
2
Beds
1
Bath
1,238
Sq Ft
$433/Sq Ft
Est. Value
About This Home
This home is located at 3070 Garfield St, Denver, CO 80205 and is currently estimated at $536,251, approximately $433 per square foot. 3070 Garfield St is a home located in Denver County with nearby schools including Columbine Elementary School, Whittier ECE-8 School, and Bruce Randolph School.
Ownership History
Date
Name
Owned For
Owner Type
Purchase Details
Closed on
Mar 14, 2003
Sold by
Rincon J Cruz and Gonzales Nonys
Bought by
Rincon J Cruz
Current Estimated Value
Home Financials for this Owner
Home Financials are based on the most recent Mortgage that was taken out on this home.
Original Mortgage
$170,520
Outstanding Balance
$72,396
Interest Rate
5.71%
Mortgage Type
FHA
Estimated Equity
$463,855
Purchase Details
Closed on
Sep 30, 1999
Sold by
Blandin Gloria F
Bought by
Rincon J Cruz and Gonzales Nonys
Home Financials for this Owner
Home Financials are based on the most recent Mortgage that was taken out on this home.
Original Mortgage
$136,089
Interest Rate
7.86%
Mortgage Type
FHA
Purchase Details
Closed on
Feb 29, 1996
Sold by
Brown Donny F
Bought by
Blandin Gloria F
Home Financials for this Owner
Home Financials are based on the most recent Mortgage that was taken out on this home.
Original Mortgage
$69,887
Interest Rate
7.01%
Mortgage Type
FHA
Create a Home Valuation Report for This Property
The Home Valuation Report is an in-depth analysis detailing your home's value as well as a comparison with similar homes in the area
Home Values in the Area
Average Home Value in this Area
Purchase History
| Date | Buyer | Sale Price | Title Company |
|---|---|---|---|
| Rincon J Cruz | -- | Commonwealth Title | |
| Rincon J Cruz | $137,000 | -- | |
| Blandin Gloria F | $69,900 | Land Title |
Source: Public Records
Mortgage History
| Date | Status | Borrower | Loan Amount |
|---|---|---|---|
| Open | Rincon J Cruz | $170,520 | |
| Closed | Rincon J Cruz | $136,089 | |
| Previous Owner | Blandin Gloria F | $69,887 | |
| Closed | Blandin Gloria F | $2,600 |
Source: Public Records
Tax History Compared to Growth
Tax History
| Year | Tax Paid | Tax Assessment Tax Assessment Total Assessment is a certain percentage of the fair market value that is determined by local assessors to be the total taxable value of land and additions on the property. | Land | Improvement |
|---|---|---|---|---|
| 2024 | $2,772 | $35,000 | $19,790 | $15,210 |
| 2023 | $2,712 | $35,000 | $19,790 | $15,210 |
| 2022 | $2,265 | $28,480 | $22,140 | $6,340 |
| 2021 | $2,186 | $29,290 | $22,770 | $6,520 |
| 2020 | $2,046 | $27,570 | $18,220 | $9,350 |
| 2019 | $1,988 | $27,570 | $18,220 | $9,350 |
| 2018 | $1,716 | $22,180 | $13,760 | $8,420 |
| 2017 | $1,711 | $22,180 | $13,760 | $8,420 |
| 2016 | $1,626 | $19,940 | $10,141 | $9,799 |
| 2015 | $1,558 | $19,940 | $10,141 | $9,799 |
| 2014 | $961 | $11,570 | $3,550 | $8,020 |
Source: Public Records
Map
Nearby Homes
- 3030 Wilson Ct Unit 5
- 3625 E 29th Ave
- 2892 Monroe St
- 2882 Monroe St
- 3080 Cook St
- 3320 N Madison St
- 2819 Jackson St
- 3251 Cook St
- 2812 Harrison St
- 3243 Albion St
- 3055 Adams St
- 3242 Albion St
- 2855 & 2875 Harrison St
- 3070 Ash St
- 3993 Haddon Rd
- 3330 Bruce Randolph Ave
- 2731 Cook St
- 3213 Steele St
- 3219 Steele St
- 3046 Saint Paul St
- 3080 Garfield St
- 3060 N Garfield St
- 3060 Garfield St
- 3050 Garfield St
- 3065 Richard Allen Ct
- 3085 Richard Allen Ct
- 3065 Garfield St
- 3055 Richard Allen Ct
- 3055 Garfield St
- 3636 E 31st Ave
- 3045 Richard Allen Ct
- 3045 Garfield St
- 3040 Garfield St
- 3751 E 31st Ave
- 3681 E 31st Ave
- 3781 E 31st Ave
- 3035 Garfield St
- 3035 Richard Allen Ct
- 3671 E 31st Ave
- 3030 Garfield St