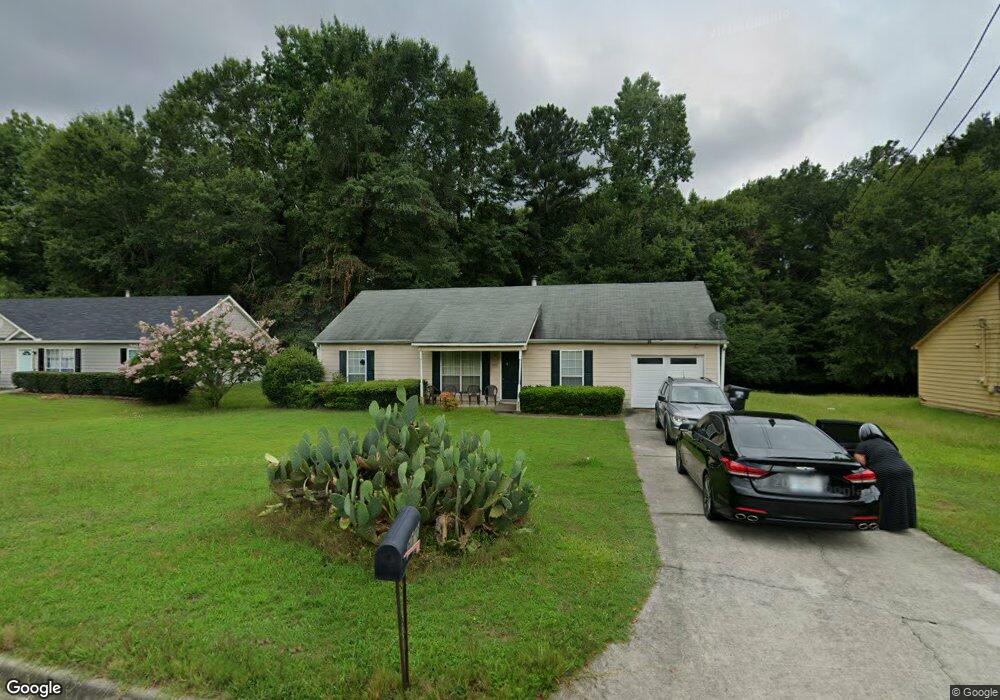
3070 Garnet Way Unit 1 Atlanta, GA 30349
Estimated Value: $215,000 - $229,556
3
Beds
2
Baths
1,470
Sq Ft
$150/Sq Ft
Est. Value
About This Home
This home is located at 3070 Garnet Way Unit 1, Atlanta, GA 30349 and is currently estimated at $220,389, approximately $149 per square foot. 3070 Garnet Way Unit 1 is a home located in Fulton County with nearby schools including Nolan Elementary School, Mcnair Middle School, and Banneker High School.
Ownership History
Date
Name
Owned For
Owner Type
Purchase Details
Closed on
Apr 30, 2020
Sold by
Johnson Vincent Estate
Bought by
Johnson Christopher Earl
Current Estimated Value
Purchase Details
Closed on
Dec 28, 2006
Sold by
Jpmorgan Chase Bank
Bought by
Johnson Vincent
Home Financials for this Owner
Home Financials are based on the most recent Mortgage that was taken out on this home.
Original Mortgage
$105,900
Interest Rate
6.1%
Mortgage Type
FHA
Purchase Details
Closed on
May 2, 2006
Sold by
Roquemore Lashanta
Bought by
Jpmorgan Chase Bank
Purchase Details
Closed on
Apr 7, 2005
Sold by
Jennings Candaisy
Bought by
Roquemore Lashanta
Home Financials for this Owner
Home Financials are based on the most recent Mortgage that was taken out on this home.
Original Mortgage
$118,750
Interest Rate
8.75%
Mortgage Type
New Conventional
Purchase Details
Closed on
Apr 25, 1995
Sold by
J J Investments Inc
Bought by
Jennings Can Daisy
Create a Home Valuation Report for This Property
The Home Valuation Report is an in-depth analysis detailing your home's value as well as a comparison with similar homes in the area
Home Values in the Area
Average Home Value in this Area
Purchase History
| Date | Buyer | Sale Price | Title Company |
|---|---|---|---|
| Johnson Christopher Earl | -- | -- | |
| Johnson Vincent | $109,900 | -- | |
| Jpmorgan Chase Bank | $103,700 | -- | |
| Roquemore Lashanta | $125,000 | -- | |
| Jennings Can Daisy | $70,000 | -- |
Source: Public Records
Mortgage History
| Date | Status | Borrower | Loan Amount |
|---|---|---|---|
| Previous Owner | Johnson Vincent | $105,900 | |
| Previous Owner | Roquemore Lashanta | $118,750 |
Source: Public Records
Tax History Compared to Growth
Tax History
| Year | Tax Paid | Tax Assessment Tax Assessment Total Assessment is a certain percentage of the fair market value that is determined by local assessors to be the total taxable value of land and additions on the property. | Land | Improvement |
|---|---|---|---|---|
| 2025 | $2,012 | $93,520 | $23,400 | $70,120 |
| 2023 | $2,464 | $87,280 | $24,440 | $62,840 |
| 2022 | $2,647 | $67,520 | $13,440 | $54,080 |
| 2021 | $2,168 | $54,160 | $9,000 | $45,160 |
| 2020 | $2,176 | $53,480 | $8,880 | $44,600 |
| 2019 | $1,787 | $45,240 | $7,720 | $37,520 |
| 2018 | $1,000 | $25,120 | $4,800 | $20,320 |
| 2017 | $892 | $21,880 | $4,720 | $17,160 |
| 2016 | $892 | $21,880 | $4,720 | $17,160 |
| 2015 | $894 | $21,880 | $4,720 | $17,160 |
| 2014 | $880 | $20,400 | $4,640 | $15,760 |
Source: Public Records
Map
Nearby Homes
- 1005 Winterside Ln
- 1005 Winter Side Ln Unit 2
- 340 Onyx Ct
- 2835 Sapphire St
- 2700 Woodward Rd
- 6305 Emerald Pointe Cir
- 6265 Gemstone Ct
- 6350 Kimberly Mill Rd Unit 1
- 200 Fox Hall Ct
- 2785 Greenbower Ct
- 6355 Kimberly Mill Rd
- 2890 Kayla Ct
- 6278 Rockaway Rd
- 6685 Greenbower Ln
- 6405 Beaver Creek Trail
- 2500 Woodward Rd
- 6590 Kimberly Mill Rd
- 6037 Hemperly Rd
- 6041 Hemperly Rd
- 3080 Garnet Way Unit 1
- 3060 Garnet Way
- 3050 Garnet Way
- 3050 Garnet Way Unit 67
- 935 Winter Side Ln
- 3090 Garnet Way Unit 1
- 310 Onyx Ct Unit 2
- 3055 Garnet Way Unit 1
- 320 Onyx Ct Unit 2
- 945 Winter Unit Ln
- 945 Winter Side Ln
- 3065 Garnet Way
- 935 Winterside Ln
- 200 Amethyst Ct Unit 1
- 3040 Garnet Way
- 300 Onyx Ct Unit 2
- 3075 Garnet Way Unit 1
- 955 Winter Side Ln
- 330 Onyx Ct Unit 2
- 3095 Garnet Way