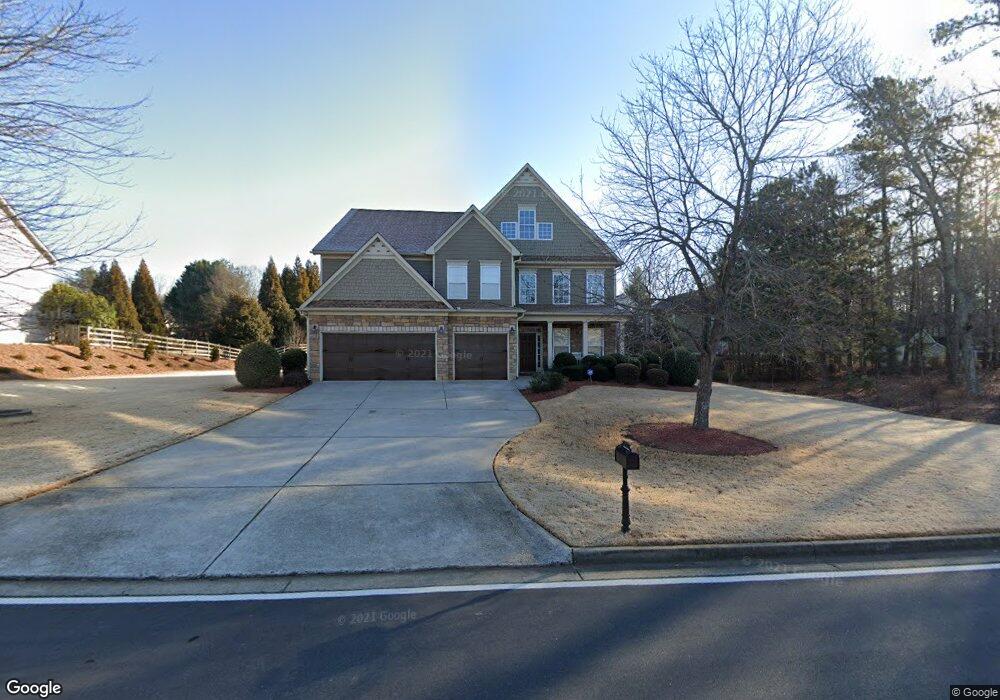
3070 Vaughan Dr Cumming, GA 30041
Big Creek NeighborhoodEstimated Value: $803,000 - $878,000
5
Beds
5
Baths
4,368
Sq Ft
$193/Sq Ft
Est. Value
About This Home
This home is located at 3070 Vaughan Dr, Cumming, GA 30041 and is currently estimated at $845,016, approximately $193 per square foot. 3070 Vaughan Dr is a home located in Forsyth County with nearby schools including Brookwood Elementary School, South Forsyth Middle School, and Lambert High School.
Ownership History
Date
Name
Owned For
Owner Type
Purchase Details
Closed on
Dec 1, 2023
Sold by
Cao Zhenyu
Bought by
Cao Zhenyu and Cao Minna
Current Estimated Value
Purchase Details
Closed on
Jun 7, 2019
Sold by
Cao Zhenyu
Bought by
Cao Zhenyu and Cao Minna
Purchase Details
Closed on
Feb 17, 2017
Sold by
Dornan Nancy R
Bought by
Zhenyu Cao
Home Financials for this Owner
Home Financials are based on the most recent Mortgage that was taken out on this home.
Original Mortgage
$395,250
Interest Rate
4.09%
Mortgage Type
New Conventional
Purchase Details
Closed on
Nov 25, 2003
Sold by
Dornan James M
Bought by
Dornan James M and Dornan Nancy
Home Financials for this Owner
Home Financials are based on the most recent Mortgage that was taken out on this home.
Original Mortgage
$224,000
Interest Rate
4.25%
Mortgage Type
New Conventional
Purchase Details
Closed on
Sep 19, 2003
Sold by
D R Horton Inc
Bought by
Dornan Jamjes M
Create a Home Valuation Report for This Property
The Home Valuation Report is an in-depth analysis detailing your home's value as well as a comparison with similar homes in the area
Home Values in the Area
Average Home Value in this Area
Purchase History
| Date | Buyer | Sale Price | Title Company |
|---|---|---|---|
| Cao Zhenyu | -- | None Listed On Document | |
| Cao Zhenyu | -- | -- | |
| Zhenyu Cao | $425,000 | -- | |
| Dornan James M | -- | -- | |
| Dornan Jamjes M | $308,200 | -- |
Source: Public Records
Mortgage History
| Date | Status | Borrower | Loan Amount |
|---|---|---|---|
| Previous Owner | Zhenyu Cao | $395,250 | |
| Previous Owner | Dornan James M | $224,000 |
Source: Public Records
Tax History Compared to Growth
Tax History
| Year | Tax Paid | Tax Assessment Tax Assessment Total Assessment is a certain percentage of the fair market value that is determined by local assessors to be the total taxable value of land and additions on the property. | Land | Improvement |
|---|---|---|---|---|
| 2025 | $5,947 | $315,220 | $78,000 | $237,220 |
| 2024 | $5,947 | $281,960 | $66,000 | $215,960 |
| 2023 | $5,221 | $259,648 | $60,000 | $199,648 |
| 2022 | $5,457 | $180,520 | $46,000 | $134,520 |
| 2021 | $4,763 | $180,520 | $46,000 | $134,520 |
| 2020 | $4,640 | $174,548 | $46,000 | $128,548 |
| 2019 | $4,624 | $173,452 | $46,000 | $127,452 |
| 2018 | $4,558 | $170,000 | $29,440 | $140,560 |
| 2017 | $4,485 | $161,612 | $28,000 | $133,612 |
| 2016 | $4,006 | $144,332 | $28,000 | $116,332 |
| 2015 | $4,013 | $144,332 | $28,000 | $116,332 |
| 2014 | $3,315 | $125,200 | $0 | $0 |
Source: Public Records
Map
Nearby Homes
- 3180 Caney Creek Ln
- 3055 Rocky Brook Dr
- 7530 Newstead Dr
- 3250 Caney Estates Place
- 3115 Arbor Song Ct
- 2875 Caney Rd
- 3030 Brookwater Dr Unit 1
- 2005 Brook Meadow Dr
- 3070 Brookwater Dr
- 3585 Lakeheath Dr
- 1250 Rosewood Dr
- 3715 Lakeheath Dr
- 140 Ashewoode Downs Ln
- St. Ives Plan at The Parc at Caney
- Heritage Manor Plan at The Parc at Caney
- Turnberry Park Plan at The Parc at Caney
- Chatham Place Plan at The Parc at Caney
- 3730 Lakeheath Dr
- 7105 Brookwood Way
- 3090 Vaughan Dr
- 3060 Vaughan Dr
- 3110 Vaughan Dr
- 3105 Caney Creek Ln
- 3050 Vaughan Dr
- 3120 Vaughan Dr
- 3120 Vaughan Dr Unit 3120
- 3110 Caney Creek Ln
- 3075 Vaughan Dr
- 3065 Vaughan Dr
- 3039 Vaughan Dr
- 3055 Vaughan Dr
- 3115 Caney Creek Ln
- 3185 Vaughan Dr
- 3460 E Gate Dr
- 3440 E Gate Dr
- 3450 E Gate Dr
- 3210 E Gate Dr
- 3205 Vaughan Dr
- 3020 Vaughan Dr