Estimated Value: $280,000
2
Beds
1
Bath
676
Sq Ft
$414/Sq Ft
Est. Value
About This Home
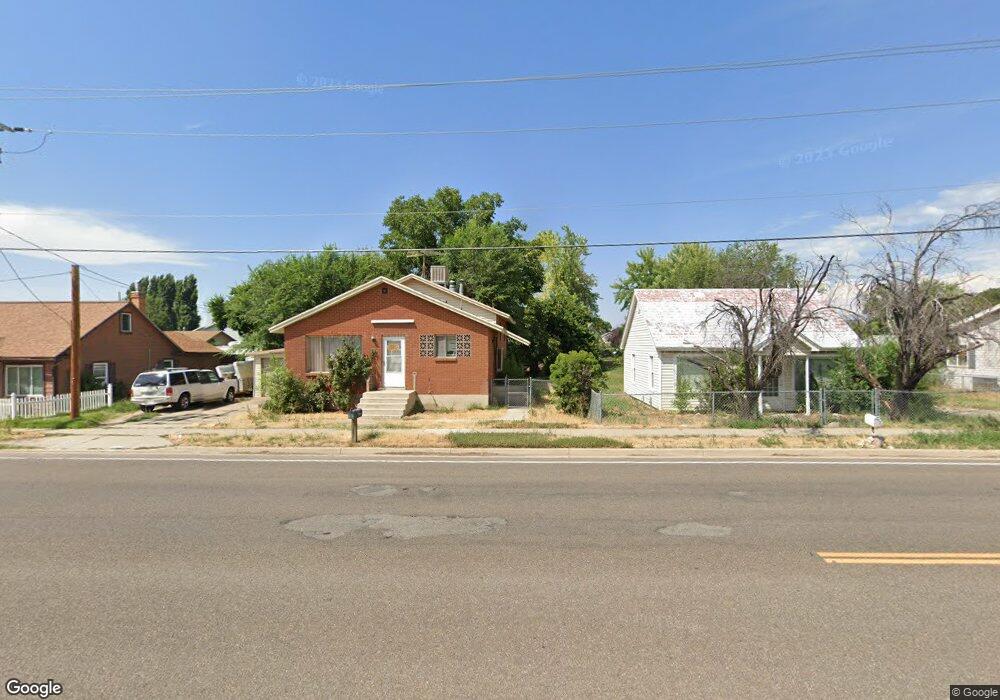
This home is located at 3070 W 5600 S, Roy, UT 84067 and is currently priced at $280,000, approximately $414 per square foot. 3070 W 5600 S is a home located in Weber County with nearby schools including Roy Elementary School, Roy Junior High School, and Roy High School.
Ownership History
Date
Name
Owned For
Owner Type
Purchase Details
Closed on
Feb 1, 2024
Sold by
Derrick James F
Bought by
Utah Department Of Transportation
Current Estimated Value
Purchase Details
Closed on
Jan 30, 2003
Sold by
Lemmon Lon H and Lemmon Elizabeth
Bought by
Derrick James F
Home Financials for this Owner
Home Financials are based on the most recent Mortgage that was taken out on this home.
Original Mortgage
$87,624
Interest Rate
5.97%
Mortgage Type
FHA
Purchase Details
Closed on
May 23, 2001
Sold by
Zampedri Timothy Scott
Bought by
Lemmon Lon H and Lemmon Elizabeth
Home Financials for this Owner
Home Financials are based on the most recent Mortgage that was taken out on this home.
Original Mortgage
$82,160
Interest Rate
7.06%
Create a Home Valuation Report for This Property
The Home Valuation Report is an in-depth analysis detailing your home's value as well as a comparison with similar homes in the area
Home Values in the Area
Average Home Value in this Area
Purchase History
| Date | Buyer | Sale Price | Title Company |
|---|---|---|---|
| Utah Department Of Transportation | -- | Inwest Title | |
| Utah Department Of Transportation | -- | Inwest Title | |
| Derrick James F | -- | Bonneville Title | |
| Lemmon Lon H | -- | Associated Title |
Source: Public Records
Mortgage History
| Date | Status | Borrower | Loan Amount |
|---|---|---|---|
| Previous Owner | Derrick James F | $87,624 | |
| Previous Owner | Lemmon Lon H | $82,160 | |
| Closed | Derrick James F | $3,504 |
Source: Public Records
Tax History
| Year | Tax Paid | Tax Assessment Tax Assessment Total Assessment is a certain percentage of the fair market value that is determined by local assessors to be the total taxable value of land and additions on the property. | Land | Improvement |
|---|---|---|---|---|
| 2023 | $1,616 | $133,650 | $57,082 | $76,568 |
| 2022 | $1,839 | $160,600 | $50,569 | $110,031 |
| 2021 | $1,466 | $208,003 | $65,724 | $142,279 |
| 2020 | $1,300 | $168,002 | $65,724 | $102,278 |
| 2019 | $1,218 | $147,000 | $39,821 | $107,179 |
| 2018 | $1,048 | $116,000 | $38,164 | $77,836 |
| 2017 | $991 | $101,999 | $38,164 | $63,835 |
| 2016 | $885 | $47,883 | $18,384 | $29,499 |
| 2015 | $820 | $44,916 | $18,384 | $26,532 |
| 2014 | $780 | $41,754 | $18,384 | $23,370 |
Source: Public Records
Map
Nearby Homes
Your Personal Tour Guide
Ask me questions while you tour the home.