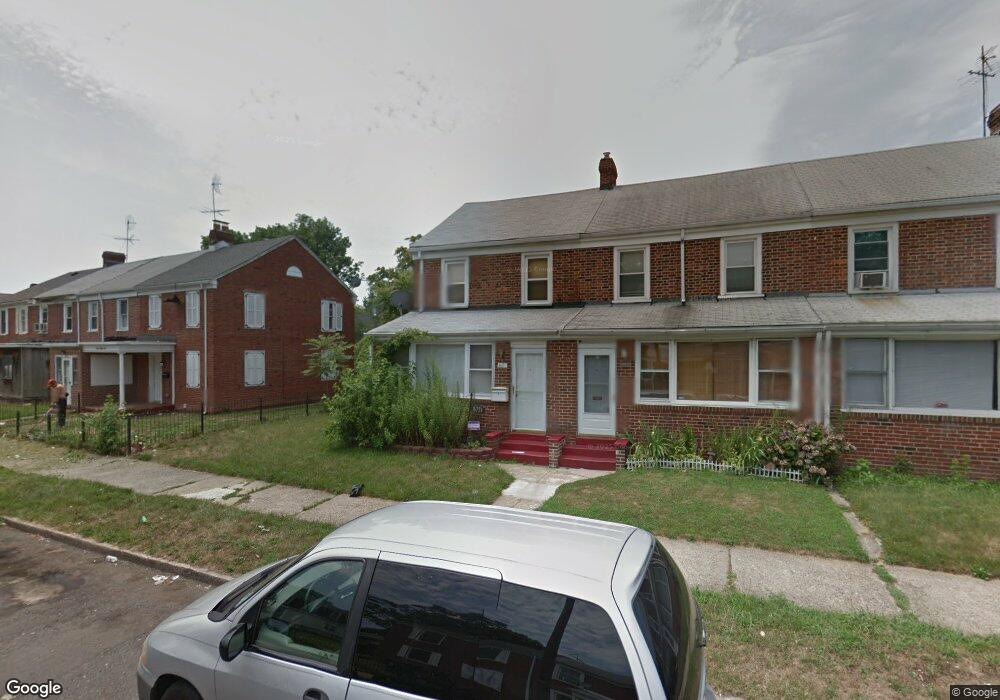
3071 Congress Rd Camden, NJ 08104
Fairview NeighborhoodEstimated Value: $88,000 - $189,000
2
Beds
1
Bath
936
Sq Ft
$157/Sq Ft
Est. Value
About This Home
This home is located at 3071 Congress Rd, Camden, NJ 08104 and is currently estimated at $147,108, approximately $157 per square foot. 3071 Congress Rd is a home located in Camden County with nearby schools including Yorkship Elementary School and Camden High School.
Ownership History
Date
Name
Owned For
Owner Type
Purchase Details
Closed on
Aug 8, 2019
Sold by
Fannie Mae
Bought by
Cruz Eric
Current Estimated Value
Home Financials for this Owner
Home Financials are based on the most recent Mortgage that was taken out on this home.
Original Mortgage
$34,000
Interest Rate
3.5%
Mortgage Type
New Conventional
Purchase Details
Closed on
Apr 11, 2019
Sold by
Crespo Pedro and Crespo Iracema
Bought by
Federal National Mortgage Association
Purchase Details
Closed on
Jul 21, 2006
Sold by
Searles Shawn
Bought by
Crespo Pedro and Crespo Iracema
Home Financials for this Owner
Home Financials are based on the most recent Mortgage that was taken out on this home.
Original Mortgage
$91,105
Interest Rate
6.7%
Purchase Details
Closed on
Jan 3, 1997
Sold by
Pokrywka James K
Bought by
Searles Shawn J
Home Financials for this Owner
Home Financials are based on the most recent Mortgage that was taken out on this home.
Original Mortgage
$38,000
Interest Rate
7.46%
Create a Home Valuation Report for This Property
The Home Valuation Report is an in-depth analysis detailing your home's value as well as a comparison with similar homes in the area
Home Values in the Area
Average Home Value in this Area
Purchase History
| Date | Buyer | Sale Price | Title Company |
|---|---|---|---|
| Cruz Eric | $42,500 | Interstate 1St Ttl Agcy Llc | |
| Federal National Mortgage Association | -- | Servicelink | |
| Crespo Pedro | $95,900 | -- | |
| Searles Shawn J | $37,900 | -- |
Source: Public Records
Mortgage History
| Date | Status | Borrower | Loan Amount |
|---|---|---|---|
| Previous Owner | Cruz Eric | $34,000 | |
| Previous Owner | Crespo Pedro | $91,105 | |
| Previous Owner | Searles Shawn J | $38,000 |
Source: Public Records
Tax History Compared to Growth
Tax History
| Year | Tax Paid | Tax Assessment Tax Assessment Total Assessment is a certain percentage of the fair market value that is determined by local assessors to be the total taxable value of land and additions on the property. | Land | Improvement |
|---|---|---|---|---|
| 2025 | $2,374 | $67,000 | $16,400 | $50,600 |
| 2024 | $2,295 | $67,000 | $16,400 | $50,600 |
| 2023 | $2,295 | $67,000 | $16,400 | $50,600 |
| 2022 | $2,252 | $67,000 | $16,400 | $50,600 |
| 2021 | $2,244 | $67,000 | $16,400 | $50,600 |
| 2020 | $2,131 | $67,000 | $16,400 | $50,600 |
| 2019 | $2,040 | $67,000 | $16,400 | $50,600 |
| 2018 | $2,029 | $67,000 | $16,400 | $50,600 |
| 2017 | $1,980 | $67,000 | $16,400 | $50,600 |
| 2016 | $1,917 | $67,000 | $16,400 | $50,600 |
| 2015 | $1,845 | $67,000 | $16,400 | $50,600 |
| 2014 | $1,801 | $67,000 | $16,400 | $50,600 |
Source: Public Records
Map
Nearby Homes
- 3069 S Congress Rd
- 3120 S Constitution Rd
- 1662 Minnesota Rd
- 3156 Alabama Rd
- 3204 Alabama Rd
- 3044 N Merrimac Rd
- 1623 Olympia Rd
- 1433 N Chesapeake Rd
- 1315 Grant Ave
- 2930 N Merrimac Rd
- 2931 N Constitution Rd
- 1325 Walnut Ave
- 1210 Eldridge Ave
- 3079 Alabama Rd
- 1316 S Merrimac Rd
- 1300 S Merrimac Rd
- 1333 Argus Rd
- 3069 S Chesapeake Rd
- 1224 Walnut Ave
- 1261 S Merrimac Rd
- 3071 S Congress Rd
- 3069 Congress Rd
- 3081 Congress Rd
- 3067 Congress Rd
- 3081 S Congress Rd
- 3083 Congress Rd
- 3083 S Congress Rd
- 3065 Congress Rd
- 3085 Congress Rd
- 3085 S Congress Rd
- 3087 S Congress Rd
- 3087 Congress Rd
- 1574 Collings Rd
- 3070 Congress Rd
- 3068 Congress Rd
- 3072 S Constitution Rd
- 3080 Congress Rd
- 3074 S Constitution Rd
- 3070 S Constitution Rd
- 3066 Congress Rd