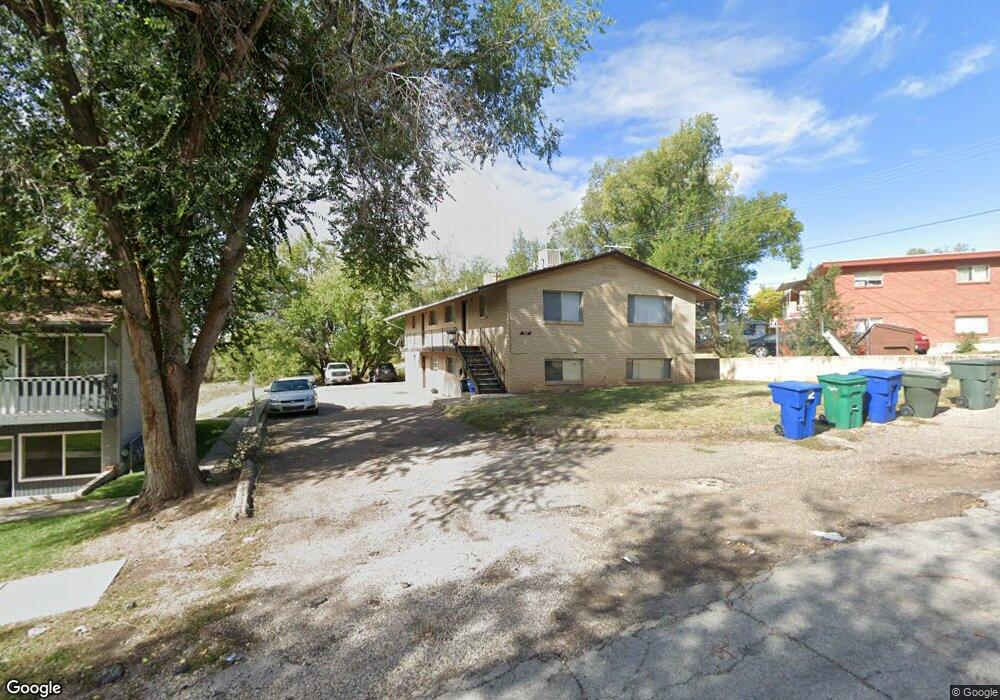
3071 Eccles Ave Unit 1 Ogden, UT 84403
TO Smith NeighborhoodEstimated Value: $682,000 - $722,000
2
Beds
1
Bath
800
Sq Ft
$870/Sq Ft
Est. Value
About This Home
This home is located at 3071 Eccles Ave Unit 1, Ogden, UT 84403 and is currently estimated at $695,667, approximately $869 per square foot. 3071 Eccles Ave Unit 1 is a home located in Weber County with nearby schools including Wasatch Elementary School, Mount Ogden Junior High School, and Ogden High School.
Ownership History
Date
Name
Owned For
Owner Type
Purchase Details
Closed on
Feb 6, 2007
Sold by
Hughes Randolph
Bought by
Kazarian Brian and Kazarian Sandra
Current Estimated Value
Home Financials for this Owner
Home Financials are based on the most recent Mortgage that was taken out on this home.
Original Mortgage
$122,300
Outstanding Balance
$73,456
Interest Rate
6.21%
Mortgage Type
Purchase Money Mortgage
Estimated Equity
$622,211
Purchase Details
Closed on
Aug 21, 2003
Sold by
Kazarian Brian and Kazarian Sandra
Bought by
Hughes Randolph
Purchase Details
Closed on
Jul 31, 2003
Sold by
Hughes Randolp
Bought by
Kazarian Brian and Kazarian Sandra
Purchase Details
Closed on
May 28, 1997
Sold by
Powers Thomas J and Powers Abbie A
Bought by
Kazarian Brian E and Kazarian Sandra J Hughes
Home Financials for this Owner
Home Financials are based on the most recent Mortgage that was taken out on this home.
Original Mortgage
$125,000
Interest Rate
7.5%
Create a Home Valuation Report for This Property
The Home Valuation Report is an in-depth analysis detailing your home's value as well as a comparison with similar homes in the area
Home Values in the Area
Average Home Value in this Area
Purchase History
| Date | Buyer | Sale Price | Title Company |
|---|---|---|---|
| Kazarian Brian | -- | None Available | |
| Hughes Randolph | -- | Mountain View Title | |
| Kazarian Brian | -- | -- | |
| Kazarian Brian E | -- | Equity Title | |
| Power Thomas J | -- | Equity Title |
Source: Public Records
Mortgage History
| Date | Status | Borrower | Loan Amount |
|---|---|---|---|
| Open | Kazarian Brian | $122,300 | |
| Previous Owner | Kazarian Brian E | $125,000 |
Source: Public Records
Tax History
| Year | Tax Paid | Tax Assessment Tax Assessment Total Assessment is a certain percentage of the fair market value that is determined by local assessors to be the total taxable value of land and additions on the property. | Land | Improvement |
|---|---|---|---|---|
| 2025 | $4,513 | $661,610 | $200,000 | $461,610 |
| 2024 | $4,487 | $646,000 | $200,000 | $446,000 |
| 2023 | $4,693 | $680,000 | $148,000 | $532,000 |
| 2022 | $4,922 | $715,000 | $100,000 | $615,000 |
| 2021 | $3,786 | $502,000 | $100,000 | $402,000 |
| 2020 | $2,947 | $361,000 | $41,361 | $319,639 |
| 2019 | $2,443 | $281,000 | $35,421 | $245,579 |
| 2018 | $1,829 | $209,000 | $35,421 | $173,579 |
| 2017 | $1,565 | $167,000 | $35,454 | $131,546 |
| 2016 | $1,592 | $91,854 | $27,500 | $64,354 |
| 2015 | $1,553 | $87,443 | $27,500 | $59,943 |
| 2014 | $1,568 | $86,719 | $16,500 | $70,219 |
Source: Public Records
Map
Nearby Homes
- 1010 Sullivan Rd
- 966 30th St
- 1119 Healy St
- 917 Sullivan Dr
- 2839 S Van Buren Ave Unit 8
- 1100 Sullivan Dr
- 895 Sullivan Rd
- 875 Patterson St
- 3040 Harrison Blvd
- 2916 Brinker Ave
- 831 30th St
- 2864 Fowler Ave
- 3175 Iowa Ave
- 3254 Quincy Ave
- 3022 Monroe Blvd
- 3287 Van Buren Ave
- 816 32nd St
- 2843 Brinker Ave
- 2846 Quincy Ave
- 3031 Monroe Blvd
- 3071 Eccles Ave
- 1035 Patterson St
- 1025 Patterson St
- 3095 Eccles Ave
- 3091 Eccles Ave
- 1015 Patterson St
- 3070 Eccles Ave Unit 8
- 3070 Eccles Ave Unit seven
- 3070 Eccles Ave Unit six
- 3070 Eccles Ave
- 3080 Eccles Ave Unit 10
- 3080 Eccles Ave Unit 12
- 3080 Eccles Ave Unit 8
- 3080 Eccles Ave
- 1055 Patterson St
- 1059 Patterson St Unit 3050
- 3045 Eccles Ave
- 3052 Jackson Ave
- 3109 Eccles Ave
- 3035 Eccles Ave
Your Personal Tour Guide
Ask me questions while you tour the home.