3071 Elijah Pkwy Lima, OH 45805
Lakewood West NeighborhoodEstimated Value: $314,000 - $345,000
6
Beds
4
Baths
2,744
Sq Ft
$120/Sq Ft
Est. Value
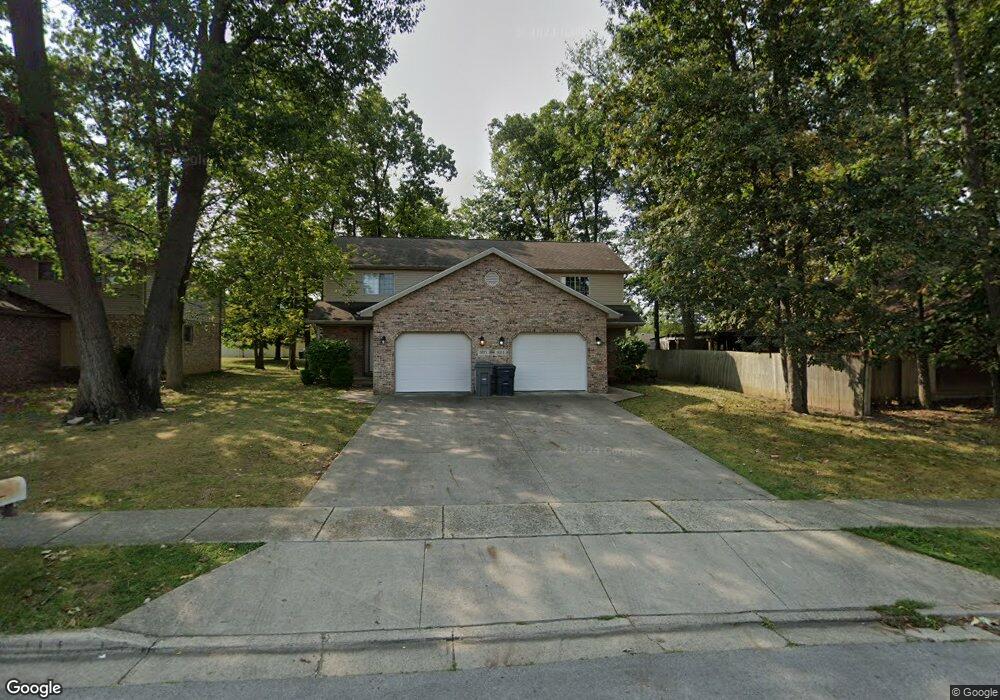
About This Home
This home is located at 3071 Elijah Pkwy, Lima, OH 45805 and is currently estimated at $328,401, approximately $119 per square foot. 3071 Elijah Pkwy is a home located in Allen County with nearby schools including Maplewood Elementary School, Elmwood Elementary School, and Shawnee Middle School.
Ownership History
Date
Name
Owned For
Owner Type
Purchase Details
Closed on
Feb 19, 2008
Sold by
Good Edwin L and Good Anita Marie
Bought by
Parkway Rental Properties Llc
Current Estimated Value
Home Financials for this Owner
Home Financials are based on the most recent Mortgage that was taken out on this home.
Original Mortgage
$140,000
Outstanding Balance
$87,566
Interest Rate
5.9%
Mortgage Type
Purchase Money Mortgage
Estimated Equity
$240,835
Purchase Details
Closed on
Feb 26, 2002
Sold by
Good David W
Bought by
Good Edwin L
Home Financials for this Owner
Home Financials are based on the most recent Mortgage that was taken out on this home.
Original Mortgage
$100,000
Interest Rate
7.14%
Mortgage Type
New Conventional
Purchase Details
Closed on
Jul 1, 1994
Sold by
Am Community Bank
Bought by
Good David
Purchase Details
Closed on
Oct 1, 1983
Bought by
Citizens Loan & Building
Create a Home Valuation Report for This Property
The Home Valuation Report is an in-depth analysis detailing your home's value as well as a comparison with similar homes in the area
Home Values in the Area
Average Home Value in this Area
Purchase History
| Date | Buyer | Sale Price | Title Company |
|---|---|---|---|
| Parkway Rental Properties Llc | $175,000 | Attorney | |
| Good Edwin L | $4,900 | -- | |
| Good David | $125,000 | -- | |
| Citizens Loan & Building | $162,600 | -- |
Source: Public Records
Mortgage History
| Date | Status | Borrower | Loan Amount |
|---|---|---|---|
| Open | Parkway Rental Properties Llc | $140,000 | |
| Previous Owner | Good Edwin L | $100,000 |
Source: Public Records
Tax History Compared to Growth
Tax History
| Year | Tax Paid | Tax Assessment Tax Assessment Total Assessment is a certain percentage of the fair market value that is determined by local assessors to be the total taxable value of land and additions on the property. | Land | Improvement |
|---|---|---|---|---|
| 2024 | $3,970 | $97,580 | $7,630 | $89,950 |
| 2023 | $3,273 | $72,840 | $5,710 | $67,130 |
| 2022 | $3,302 | $72,840 | $5,710 | $67,130 |
| 2021 | $3,321 | $72,840 | $5,710 | $67,130 |
| 2020 | $2,553 | $59,330 | $5,390 | $53,940 |
| 2019 | $2,553 | $59,330 | $5,390 | $53,940 |
| 2018 | $2,571 | $59,330 | $5,390 | $53,940 |
| 2017 | $2,599 | $59,330 | $5,390 | $53,940 |
| 2016 | $2,573 | $59,330 | $5,390 | $53,940 |
| 2015 | $2,571 | $59,330 | $5,390 | $53,940 |
| 2014 | $2,466 | $56,210 | $5,530 | $50,680 |
| 2013 | $2,413 | $56,210 | $5,530 | $50,680 |
Source: Public Records
Map
Nearby Homes
- 2997 Cletus Pkwy
- 250 Squire Ln
- 1214 Winterberry Dr
- 2921 Canterbury Dr
- 0 Springview Dr
- 901 Gloria Ave
- 2958 Hanover Dr
- 1408 Winghaven Dr
- 3390 Spencerville Rd
- 704 Bentwood Dr
- 00 Seriff
- 1453 W Shore Dr
- 1424 Loch Loman Way
- 2225 Arcadia Ave
- 1446 Adak Ave
- 1462 Adak Ave
- 2297 June Dr
- 2700 Lowell Ave
- XXXX Spencerville Rd
- 2149 Arcadia Ave
- 3051 Elijah Pkwy Unit Elijah PKWY
- 3091 Elijah Pkwy
- 3060 Jenny Place
- 3050 Jenny Place
- 3031 Elijah Pkwy
- 3070 Jenny Place
- 3070 Elijah Pkwy
- 3050 Elijah Pkwy
- 3080 Elijah Pkwy
- 3011 Elijah Pkwy
- 3040 Elijah Pkwy
- 3030 Jenny Place
- 1120 Westerly Dr
- 1140 Westerly Dr
- 3030 Elijah Pkwy
- 3071 Jenny Place
- 3051 Jenny Place
- 3061 Cletus Pkwy
- 3041 Cletus Pkwy