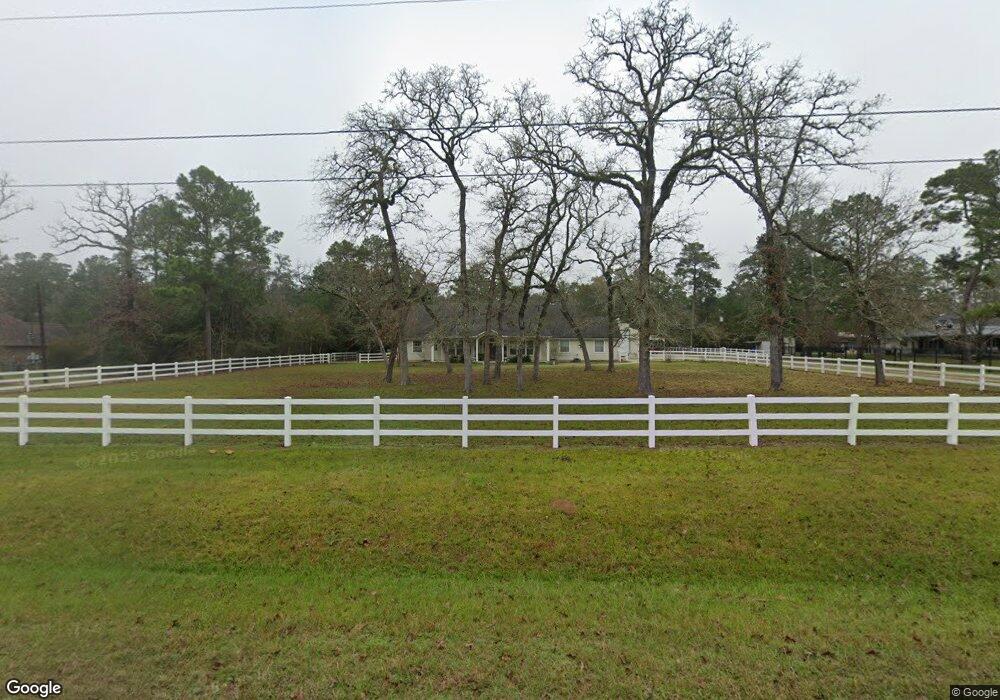
30718 N High Meadow Cir Magnolia, TX 77355
Estimated Value: $682,694 - $764,000
4
Beds
3
Baths
2,688
Sq Ft
$266/Sq Ft
Est. Value
About This Home
This home is located at 30718 N High Meadow Cir, Magnolia, TX 77355 and is currently estimated at $716,174, approximately $266 per square foot. 30718 N High Meadow Cir is a home located in Montgomery County with nearby schools including J.L. Lyon Elementary School, Magnolia Sixth Grade Campus, and Magnolia Junior High School.
Ownership History
Date
Name
Owned For
Owner Type
Purchase Details
Closed on
Aug 31, 2009
Sold by
Johnson Terry L and Johnson Wanda
Bought by
Longbottom James Robert and Longbottom Syrisse Seale
Current Estimated Value
Home Financials for this Owner
Home Financials are based on the most recent Mortgage that was taken out on this home.
Original Mortgage
$279,249
Outstanding Balance
$182,721
Interest Rate
5.2%
Mortgage Type
New Conventional
Estimated Equity
$533,453
Purchase Details
Closed on
Sep 29, 2005
Sold by
Davis Joe
Bought by
Johnson Terry L
Home Financials for this Owner
Home Financials are based on the most recent Mortgage that was taken out on this home.
Original Mortgage
$265,590
Interest Rate
5.73%
Mortgage Type
VA
Purchase Details
Closed on
Apr 28, 2000
Sold by
Ledoux Scott B and Ledoux Melissa A
Bought by
Longbottom James E and Longbottom Syrisse
Create a Home Valuation Report for This Property
The Home Valuation Report is an in-depth analysis detailing your home's value as well as a comparison with similar homes in the area
Home Values in the Area
Average Home Value in this Area
Purchase History
| Date | Buyer | Sale Price | Title Company |
|---|---|---|---|
| Longbottom James Robert | -- | Stewart Title Of Montgomery | |
| Johnson Terry L | -- | Alamo Title Company | |
| Longbottom James E | -- | -- |
Source: Public Records
Mortgage History
| Date | Status | Borrower | Loan Amount |
|---|---|---|---|
| Open | Longbottom James Robert | $279,249 | |
| Previous Owner | Johnson Terry L | $265,590 |
Source: Public Records
Tax History Compared to Growth
Tax History
| Year | Tax Paid | Tax Assessment Tax Assessment Total Assessment is a certain percentage of the fair market value that is determined by local assessors to be the total taxable value of land and additions on the property. | Land | Improvement |
|---|---|---|---|---|
| 2025 | $9,477 | $627,824 | $144,360 | $483,464 |
| 2024 | $9,293 | $598,657 | $144,360 | $454,297 |
| 2023 | $9,293 | $588,680 | $144,360 | $444,320 |
| 2022 | $10,215 | $578,900 | $144,680 | $434,220 |
| 2021 | $7,961 | $428,330 | $88,220 | $340,110 |
| 2020 | $7,687 | $379,830 | $88,220 | $291,610 |
| 2019 | $7,464 | $370,630 | $88,220 | $282,410 |
| 2018 | $7,259 | $343,380 | $60,150 | $283,230 |
| 2017 | $7,425 | $350,140 | $60,150 | $289,990 |
| 2016 | $7,013 | $330,710 | $60,150 | $270,560 |
| 2015 | $6,589 | $331,860 | $60,150 | $271,710 |
| 2014 | $6,589 | $307,220 | $25,060 | $282,160 |
Source: Public Records
Map
Nearby Homes
- 25103 Lake Park Ct
- 30311 N Holly Oaks Cir
- Lot 152 Nottingham Cir
- 25402 Holly Oaks Ct
- 30103 Thousand Oaks Ct
- 30003 Desert Willow Ct
- 22914 Bramblevine Dr
- 25319 Penguin St
- 25091 Little John Cir
- 22920 Blackgum Dr
- 20127 Sapphire Cir
- 25137 Little John Cir
- 451 Pelican St
- 289 Pelican St
- 22806 Lantana Dr
- 28126 Walnut Creek Ct
- 24765 Friar Tuck Dr
- 545 Wax Myrtle Way
- 549 Wax Myrtle Way
- 540 Wax Myrtle Way
- 30710 N High Meadow Cir
- 30724 N High Meadow Cir
- 30810 N High Meadow Cir
- 30702 N High Meadow Cir
- 30703 N High Meadow Cir
- 25303 Winding Creek Ct
- 30711 N High Meadow Cir
- 25311 Winding Creek Ct
- 0 N High Meadow Cir
- 30619 N High Meadow Cir
- 30811 N High Meadow Cir
- 30610 N High Meadow Cir
- 25302 Winding Creek Ct
- 30902 N High Meadow Cir
- 25319 Winding Creek Ct
- 0 Winding Creek Ct
- 30611 N High Meadow Cir
- 30602 N High Meadow Cir
- 30718 N Holly Oaks Cir
- 30810 N Holly Oaks Cir