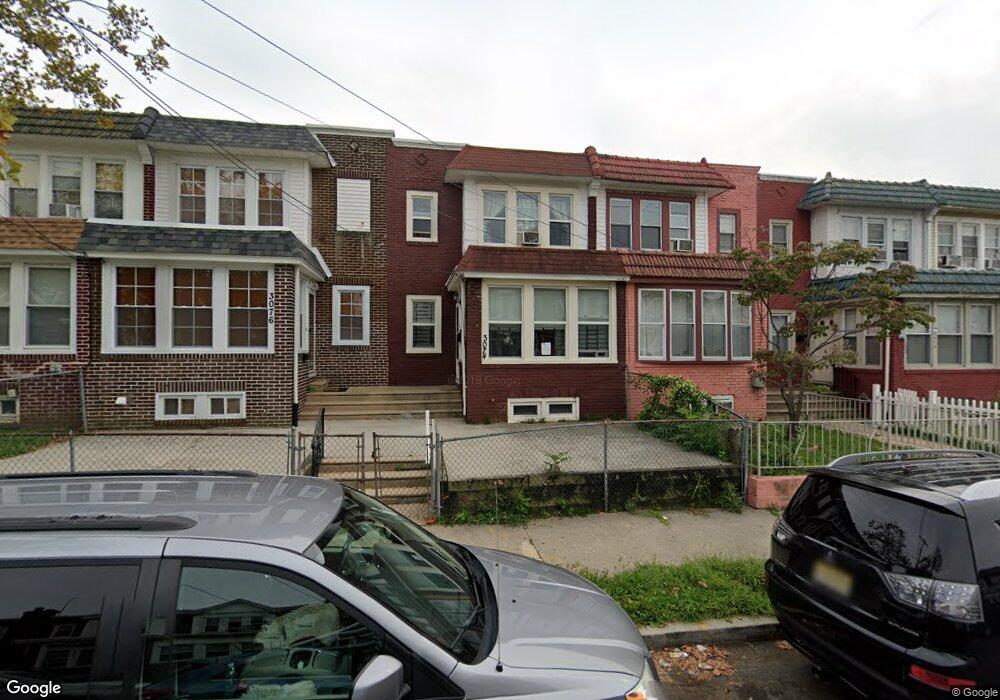
3072 Carman St Camden, NJ 08105
Stockton NeighborhoodEstimated Value: $157,268 - $180,000
--
Bed
--
Bath
1,218
Sq Ft
$137/Sq Ft
Est. Value
About This Home
This home is located at 3072 Carman St, Camden, NJ 08105 and is currently estimated at $167,067, approximately $137 per square foot. 3072 Carman St is a home located in Camden County with nearby schools including Eastside High School, St Joseph Pro-Cathedral School, and Camden Forward School.
Ownership History
Date
Name
Owned For
Owner Type
Purchase Details
Closed on
Aug 3, 2006
Sold by
Rodriguez Luz Maria
Bought by
Isaac Miguel A and Isaac Jineth
Current Estimated Value
Home Financials for this Owner
Home Financials are based on the most recent Mortgage that was taken out on this home.
Original Mortgage
$82,702
Outstanding Balance
$49,842
Interest Rate
6.83%
Mortgage Type
FHA
Estimated Equity
$117,225
Purchase Details
Closed on
Oct 1, 2003
Sold by
Cruz Juan M
Bought by
Rodriguez Luz Maria
Create a Home Valuation Report for This Property
The Home Valuation Report is an in-depth analysis detailing your home's value as well as a comparison with similar homes in the area
Home Values in the Area
Average Home Value in this Area
Purchase History
| Date | Buyer | Sale Price | Title Company |
|---|---|---|---|
| Isaac Miguel A | $84,000 | -- | |
| Rodriguez Luz Maria | $43,000 | -- |
Source: Public Records
Mortgage History
| Date | Status | Borrower | Loan Amount |
|---|---|---|---|
| Open | Isaac Miguel A | $82,702 | |
| Closed | Rodriguez Luz Maria | -- |
Source: Public Records
Tax History Compared to Growth
Tax History
| Year | Tax Paid | Tax Assessment Tax Assessment Total Assessment is a certain percentage of the fair market value that is determined by local assessors to be the total taxable value of land and additions on the property. | Land | Improvement |
|---|---|---|---|---|
| 2025 | $2,558 | $72,200 | $16,300 | $55,900 |
| 2024 | $2,473 | $72,200 | $16,300 | $55,900 |
| 2023 | $2,473 | $72,200 | $16,300 | $55,900 |
| 2022 | $2,427 | $72,200 | $16,300 | $55,900 |
| 2021 | $2,418 | $72,200 | $16,300 | $55,900 |
| 2020 | $2,296 | $72,200 | $16,300 | $55,900 |
| 2019 | $2,198 | $72,200 | $16,300 | $55,900 |
| 2018 | $2,187 | $72,200 | $16,300 | $55,900 |
| 2017 | $2,134 | $72,200 | $16,300 | $55,900 |
| 2016 | $2,066 | $72,200 | $16,300 | $55,900 |
| 2015 | $1,988 | $72,200 | $16,300 | $55,900 |
| 2014 | $1,941 | $72,200 | $16,300 | $55,900 |
Source: Public Records
Map
Nearby Homes
- 3075 Stevens St
- 2937 Carman St
- 113 S 32nd St
- 3170 Merriel Ave
- 226 Wilmot Ave
- 224 S 32nd St
- 127 N 33rd St
- 2934 Cramer St
- 363 Garden Ave
- 3001 Royden St
- 2817 Westfield Ave
- 106 N 34th St
- 2933 Royden St
- 402 S 30th St
- 100 E 28th St
- 3027 Morrison St
- 154 Eutaw Ave
- 355 S 27th St
- 3733 Drexel Ave
- 3619 Fremont Ave