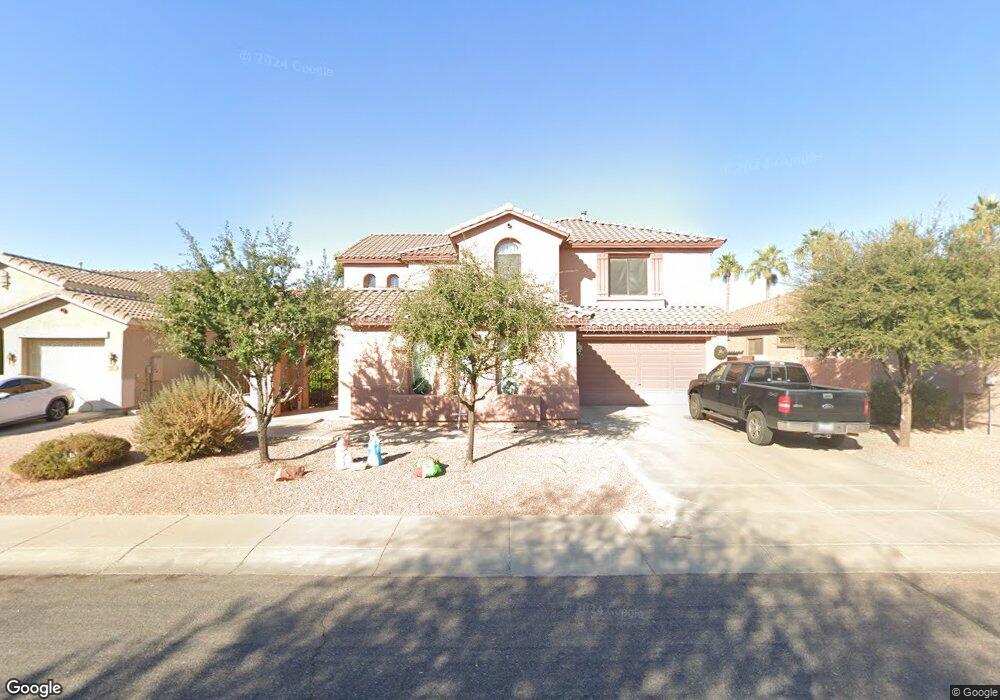
3072 E Oriole Way Chandler, AZ 85286
South Chandler NeighborhoodEstimated Value: $697,646 - $776,000
5
Beds
3
Baths
3,049
Sq Ft
$242/Sq Ft
Est. Value
About This Home
This home is located at 3072 E Oriole Way, Chandler, AZ 85286 and is currently estimated at $737,162, approximately $241 per square foot. 3072 E Oriole Way is a home located in Maricopa County with nearby schools including Haley Elementary School, Santan Junior High School, and Archway Classical Academy - Lincoln.
Ownership History
Date
Name
Owned For
Owner Type
Purchase Details
Closed on
May 13, 2009
Sold by
Perez Edna
Bought by
Swanson Scott R and Swanson Elizabeth A
Current Estimated Value
Home Financials for this Owner
Home Financials are based on the most recent Mortgage that was taken out on this home.
Original Mortgage
$258,250
Outstanding Balance
$162,905
Interest Rate
4.82%
Mortgage Type
VA
Estimated Equity
$574,257
Purchase Details
Closed on
Apr 19, 2005
Sold by
Cresleigh Homes Arizona Inc
Bought by
Perez Edna
Home Financials for this Owner
Home Financials are based on the most recent Mortgage that was taken out on this home.
Original Mortgage
$260,728
Interest Rate
9%
Mortgage Type
Fannie Mae Freddie Mac
Create a Home Valuation Report for This Property
The Home Valuation Report is an in-depth analysis detailing your home's value as well as a comparison with similar homes in the area
Home Values in the Area
Average Home Value in this Area
Purchase History
| Date | Buyer | Sale Price | Title Company |
|---|---|---|---|
| Swanson Scott R | $250,000 | Fidelity Natl Title Ins Co | |
| Perez Edna | $289,698 | First American Title Ins Co |
Source: Public Records
Mortgage History
| Date | Status | Borrower | Loan Amount |
|---|---|---|---|
| Open | Swanson Scott R | $258,250 | |
| Previous Owner | Perez Edna | $260,728 |
Source: Public Records
Tax History
| Year | Tax Paid | Tax Assessment Tax Assessment Total Assessment is a certain percentage of the fair market value that is determined by local assessors to be the total taxable value of land and additions on the property. | Land | Improvement |
|---|---|---|---|---|
| 2025 | $3,134 | $39,546 | -- | -- |
| 2024 | $3,011 | $37,663 | -- | -- |
| 2023 | $3,011 | $53,220 | $10,640 | $42,580 |
| 2022 | $2,907 | $39,800 | $7,960 | $31,840 |
| 2021 | $3,039 | $36,860 | $7,370 | $29,490 |
| 2020 | $3,024 | $35,560 | $7,110 | $28,450 |
| 2019 | $2,910 | $32,950 | $6,590 | $26,360 |
| 2018 | $2,816 | $31,810 | $6,360 | $25,450 |
| 2017 | $2,627 | $30,650 | $6,130 | $24,520 |
| 2016 | $2,518 | $29,150 | $5,830 | $23,320 |
| 2015 | $2,449 | $27,900 | $5,580 | $22,320 |
Source: Public Records
Map
Nearby Homes
- 3097 E Raven Ct
- 3273 E Oriole Way
- 2537 S Santa Rita Way
- 3450 E Lark Dr
- 2415 S Whetstone Place Unit 2
- 3693 E Sparrow Place
- 590 E Raven Ct
- 3233 E Lantana Place
- 2165 S Douglas Dr Unit 182
- 3200 S Pinnacle Dr
- 4702 S Riata St
- 4748 S Riata St
- 658 E Rojo Way
- 621 E Buckingham Ave
- 4548 S Renaissance Dr Unit 103
- 747 E Charlevoix Ave
- 736 E Rojo Way Unit 101
- 759 E Lark St Unit 202
- 761 E Furness Dr Unit 101
- 3330 S Gilbert Rd Unit 1072
- 3082 E Oriole Way
- 3062 E Oriole Way
- 3052 E Oriole Way
- 3073 E Oriole Way
- 3083 E Oriole Way
- 3093 E Oriole Way
- 2521 S Dragoon Dr
- 3112 E Oriole Way
- 2520 S Dragoon Dr
- 3051 E Lark Dr Unit 1
- 3061 E Lark Dr
- 3103 E Oriole Way
- 3071 E Lark Dr Unit 1
- 3031 E Lark Dr
- 3084 E Cardinal Ct
- 2531 S Dragoon Dr
- 3122 E Oriole Way
- 3081 E Lark Dr
- 2530 S Dragoon Dr
- 3021 E Lark Dr
Your Personal Tour Guide
Ask me questions while you tour the home.