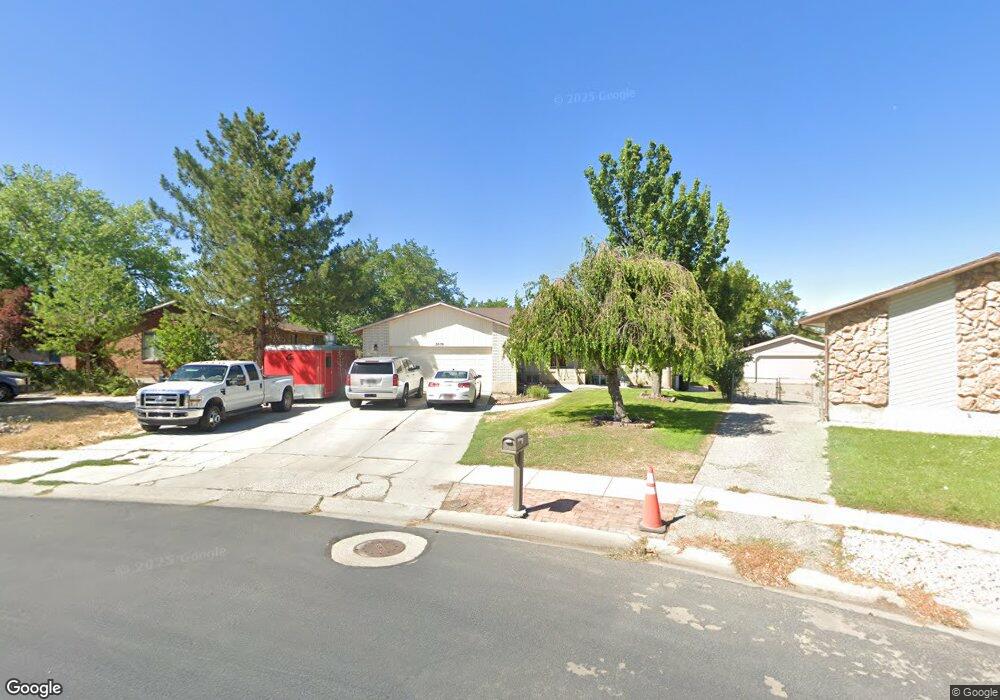
3076 Skyvue Cir West Jordan, UT 84088
Estimated Value: $580,000 - $611,000
4
Beds
3
Baths
1,500
Sq Ft
$398/Sq Ft
Est. Value
About This Home
This home is located at 3076 Skyvue Cir, West Jordan, UT 84088 and is currently estimated at $597,197, approximately $398 per square foot. 3076 Skyvue Cir is a home located in Salt Lake County with nearby schools including Terra Linda Elementary School, Joel P. Jensen Middle School, and West Jordan High School.
Ownership History
Date
Name
Owned For
Owner Type
Purchase Details
Closed on
Jul 14, 2023
Sold by
Brent R And Laurel B Dimond Family Trust
Bought by
Matavao Paulasi Laki and Matavao Wendi Dimond
Current Estimated Value
Purchase Details
Closed on
Oct 26, 2005
Sold by
Dimond Brent R and Dimond Laurel B
Bought by
Dimond Brent R and Dimond Laurel B
Purchase Details
Closed on
Dec 16, 1993
Sold by
Dimond Brent Robert and Dimond Laurel B
Bought by
Dimond Brent R and Dimond Laurel B
Home Financials for this Owner
Home Financials are based on the most recent Mortgage that was taken out on this home.
Original Mortgage
$82,000
Interest Rate
7.09%
Create a Home Valuation Report for This Property
The Home Valuation Report is an in-depth analysis detailing your home's value as well as a comparison with similar homes in the area
Home Values in the Area
Average Home Value in this Area
Purchase History
| Date | Buyer | Sale Price | Title Company |
|---|---|---|---|
| Matavao Paulasi Laki | -- | None Listed On Document | |
| Dimond Brent R | -- | None Available | |
| Dimond Brent R | -- | Metro National Title |
Source: Public Records
Mortgage History
| Date | Status | Borrower | Loan Amount |
|---|---|---|---|
| Previous Owner | Dimond Brent R | $82,000 |
Source: Public Records
Tax History Compared to Growth
Tax History
| Year | Tax Paid | Tax Assessment Tax Assessment Total Assessment is a certain percentage of the fair market value that is determined by local assessors to be the total taxable value of land and additions on the property. | Land | Improvement |
|---|---|---|---|---|
| 2025 | $2,939 | $578,300 | $172,900 | $405,400 |
| 2024 | $2,939 | $565,500 | $169,700 | $395,800 |
| 2023 | $2,949 | $515,800 | $163,200 | $352,600 |
| 2022 | $2,949 | $526,000 | $160,000 | $366,000 |
| 2021 | $2,439 | $396,100 | $114,100 | $282,000 |
| 2020 | $2,369 | $361,100 | $114,100 | $247,000 |
| 2019 | $2,362 | $353,000 | $114,100 | $238,900 |
| 2018 | $2,175 | $322,400 | $109,600 | $212,800 |
| 2017 | $1,958 | $289,000 | $109,600 | $179,400 |
| 2016 | $1,714 | $237,600 | $109,600 | $128,000 |
| 2015 | $1,865 | $252,100 | $111,600 | $140,500 |
| 2014 | $1,908 | $253,900 | $113,700 | $140,200 |
Source: Public Records
Map
Nearby Homes
- 8407 Meadow Green Way
- 3112 Green Acre Dr
- 8493 S 3200 W
- 7987 S 2980 W
- 7993 S 2760 W
- 3332 Lower Newark Way
- 7968 S 2700 W
- 3066 W Linton Dr
- 7942 S 2800 W
- 8058 S Lismore Ln
- 8180 S Old Bingham Hwy
- 4000 W 8400 S Unit 83
- 2497 Bueno Vista Dr
- 3165 W 7720 S
- 7721 Sunset Cir
- 3354 W 7800 S
- 48 San Rafael Ct
- 3476 W Spaulding Rd
- 3546 W 7980 S
- 77 Rio Bravo Place
- 3080 Skyvue Cir
- 3080 W Skyvue Cir
- 8211 Skyvue Cir
- 3088 W Skyvue Cir
- 8198 S 2900 W
- 8194 S 2900 W
- 8217 Skyvue Cir
- 3085 W Skyvue Cir
- 3085 Skyvue Cir
- 8206 S 2900 W
- 3102 Skyvue Cir
- 3102 W Skyvue Cir
- 3097 Skyvue Cir
- 8216 S 2900 W
- 3084 Skyvue Cir
- 3084 W Skyvue Cir
- 8223 S Skyvue Cir
- 8223 Skyvue Cir
- 8226 S 2900 W
- 3114 W Skyvue Cir