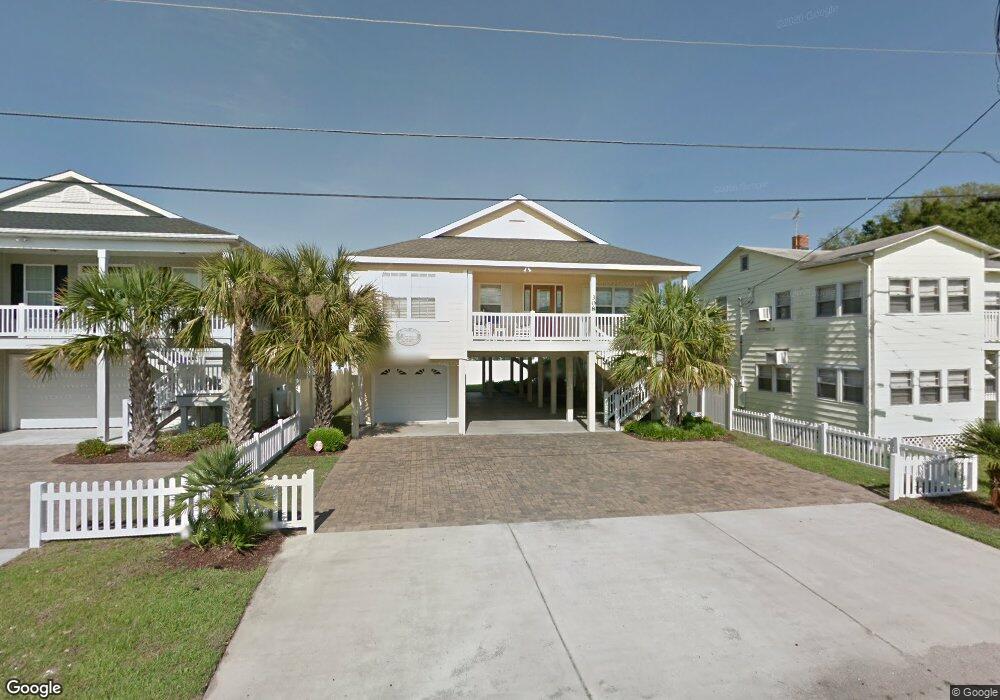
308 25th Ave N North Myrtle Beach, SC 29582
Cherry Grove NeighborhoodEstimated Value: $652,939 - $802,000
4
Beds
3
Baths
1,800
Sq Ft
$403/Sq Ft
Est. Value
About This Home
This home is located at 308 25th Ave N, North Myrtle Beach, SC 29582 and is currently estimated at $725,735, approximately $403 per square foot. 308 25th Ave N is a home located in Horry County with nearby schools including Ocean Drive Elementary School, North Myrtle Beach Middle School, and North Myrtle Beach High School.
Ownership History
Date
Name
Owned For
Owner Type
Purchase Details
Closed on
Mar 11, 2022
Sold by
Small Hilda M
Bought by
Burroughs Gordon Trent and Burroughs Alison S
Current Estimated Value
Purchase Details
Closed on
Feb 26, 2009
Sold by
Seacoast Construction Company Inc
Bought by
Small Hilda M
Purchase Details
Closed on
Jan 8, 2009
Sold by
Bryants Construction Inc
Bought by
Seacoast Construction Company Inc
Purchase Details
Closed on
May 2, 2008
Sold by
Jones & Roberts Realty & Development Llc
Bought by
Bryants Construction Inc
Home Financials for this Owner
Home Financials are based on the most recent Mortgage that was taken out on this home.
Original Mortgage
$349,325
Interest Rate
5.84%
Mortgage Type
Construction
Purchase Details
Closed on
Oct 30, 2006
Sold by
Bullins Billy Joe and Bullins Carolyn M
Bought by
Jones & Roberts Realty & Development Llc
Purchase Details
Closed on
Mar 20, 2000
Sold by
Watt Sharon F
Bought by
Bullins Billy Joe and Bullins Carolyn
Create a Home Valuation Report for This Property
The Home Valuation Report is an in-depth analysis detailing your home's value as well as a comparison with similar homes in the area
Home Values in the Area
Average Home Value in this Area
Purchase History
| Date | Buyer | Sale Price | Title Company |
|---|---|---|---|
| Burroughs Gordon Trent | -- | -- | |
| Small Hilda M | $472,000 | -- | |
| Seacoast Construction Company Inc | $79,669 | -- | |
| Bryants Construction Inc | $240,000 | -- | |
| Jones & Roberts Realty & Development Llc | $200,000 | None Available | |
| Bullins Billy Joe | $98,000 | -- |
Source: Public Records
Mortgage History
| Date | Status | Borrower | Loan Amount |
|---|---|---|---|
| Previous Owner | Bryants Construction Inc | $349,325 |
Source: Public Records
Tax History Compared to Growth
Tax History
| Year | Tax Paid | Tax Assessment Tax Assessment Total Assessment is a certain percentage of the fair market value that is determined by local assessors to be the total taxable value of land and additions on the property. | Land | Improvement |
|---|---|---|---|---|
| 2024 | $7,167 | $33,148 | $18,000 | $15,148 |
| 2023 | $7,167 | $18,306 | $10,008 | $8,298 |
| 2021 | $4,144 | $39,575 | $19,425 | $20,150 |
| 2020 | $4,098 | $39,575 | $19,425 | $20,150 |
| 2019 | $3,953 | $39,575 | $19,425 | $20,150 |
| 2018 | $0 | $27,857 | $15,225 | $12,632 |
| 2017 | $0 | $15,918 | $8,700 | $7,218 |
| 2016 | $0 | $15,918 | $8,700 | $7,218 |
| 2015 | -- | $15,918 | $8,700 | $7,218 |
| 2014 | $3,464 | $15,918 | $8,700 | $7,218 |
Source: Public Records
Map
Nearby Homes
- 219 27th Ave N
- 204 24th Ave N
- 409 25th Ave N
- 407 24th Ave N Unit 301
- 310 23rd Ave N
- 204 27th Ave N
- 210 28th Ave N Unit B
- 210 28th Ave N Unit B
- 210 28th Ave N
- 2500 N Ocean Blvd Unit The Oceans 1014
- 2500 N Ocean Blvd Unit 507
- 2500 N Ocean Blvd Unit 705
- 2500 N Ocean Blvd Unit 609
- 2500 N Ocean Blvd Unit 607
- 2500 N Ocean Blvd Unit 709
- 2701 N Ocean Blvd Unit 1-0707
- 317 29th Ave N
- 317 23rd Ave N
- 202 28th Ave N Unit 5
- 304 29th Ave N
- 306 25th Ave N
- 310 25th Ave N
- 307 26th Ave N
- 309 26th Ave N
- 304 25th Ave N
- 312 25th Ave N
- 311 26th Ave N
- 305 26th Ave N Unit Cherry Grove
- 305 26th Ave N
- 313 26th Ave N
- 307 25th Ave N Unit Cherry Grove
- 307 25th Ave N
- 314 25th Ave N Unit Cherry Grove
- 314 25th Ave N
- 303 26th Ave N
- 309 25th Ave N
- 305 25th Ave N
- 303 25th Ave N
- 302 25th Ave N
- 315 26th Ave N