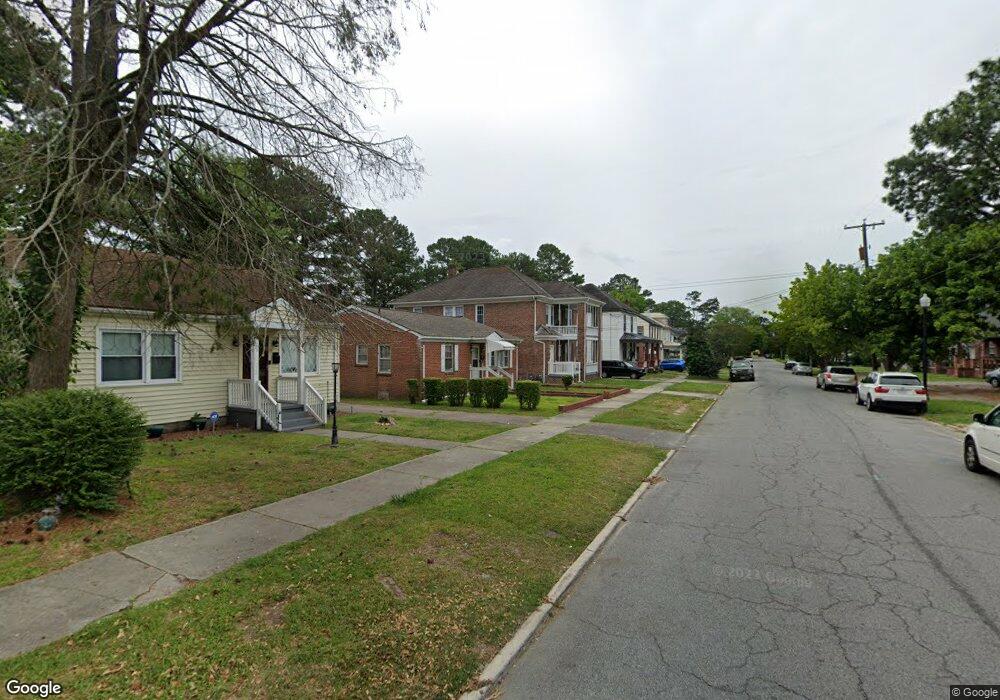
308 Cedar St Unit 1/2 Suffolk, VA 23434
Holy Neck NeighborhoodEstimated Value: $197,000 - $312,000
3
Beds
1
Bath
1,695
Sq Ft
$151/Sq Ft
Est. Value
About This Home
This home is located at 308 Cedar St Unit 1/2, Suffolk, VA 23434 and is currently estimated at $256,767, approximately $151 per square foot. 308 Cedar St Unit 1/2 is a home located in Suffolk City with nearby schools including Booker T. Washington Elementary School, King's Fork Middle School, and Lakeland High School.
Ownership History
Date
Name
Owned For
Owner Type
Purchase Details
Closed on
Apr 8, 2022
Sold by
Brierre Polo Jean and Monet Monilla
Bought by
318 Cedar St Llc
Current Estimated Value
Home Financials for this Owner
Home Financials are based on the most recent Mortgage that was taken out on this home.
Original Mortgage
$179,625
Outstanding Balance
$166,556
Interest Rate
3.89%
Mortgage Type
New Conventional
Estimated Equity
$90,211
Purchase Details
Closed on
Mar 5, 2022
Sold by
Allegory Llc
Bought by
Dent Monilla Monet and Polo Jean Brierre
Home Financials for this Owner
Home Financials are based on the most recent Mortgage that was taken out on this home.
Original Mortgage
$179,625
Outstanding Balance
$166,556
Interest Rate
3.89%
Mortgage Type
New Conventional
Estimated Equity
$90,211
Purchase Details
Closed on
Aug 31, 2020
Sold by
Leggett Properties Llc
Bought by
Allegory Llc
Home Financials for this Owner
Home Financials are based on the most recent Mortgage that was taken out on this home.
Original Mortgage
$103,000
Interest Rate
3%
Mortgage Type
Commercial
Create a Home Valuation Report for This Property
The Home Valuation Report is an in-depth analysis detailing your home's value as well as a comparison with similar homes in the area
Home Values in the Area
Average Home Value in this Area
Purchase History
| Date | Buyer | Sale Price | Title Company |
|---|---|---|---|
| 318 Cedar St Llc | -- | Liberty Title | |
| Dent Monilla Monet | -- | Fidelity National Title | |
| Allegory Llc | $135,000 | Va Home Title & Settlements |
Source: Public Records
Mortgage History
| Date | Status | Borrower | Loan Amount |
|---|---|---|---|
| Open | Dent Monilla Monet | $179,625 | |
| Previous Owner | Allegory Llc | $103,000 |
Source: Public Records
Tax History
| Year | Tax Paid | Tax Assessment Tax Assessment Total Assessment is a certain percentage of the fair market value that is determined by local assessors to be the total taxable value of land and additions on the property. | Land | Improvement |
|---|---|---|---|---|
| 2025 | $2,758 | $182,100 | $28,800 | $153,300 |
| 2024 | $2,758 | $182,300 | $36,000 | $146,300 |
| 2023 | $2,647 | $175,300 | $36,000 | $139,300 |
| 2022 | $1,529 | $140,300 | $22,500 | $117,800 |
| 2021 | $1,557 | $140,300 | $22,500 | $117,800 |
| 2020 | $1,557 | $140,300 | $22,500 | $117,800 |
| 2019 | $1,557 | $140,300 | $22,500 | $117,800 |
| 2018 | $1,756 | $139,600 | $22,500 | $117,100 |
| 2017 | $1,494 | $139,600 | $22,500 | $117,100 |
| 2016 | $1,494 | $139,600 | $22,500 | $117,100 |
| 2015 | $919 | $139,600 | $22,500 | $117,100 |
| 2014 | $919 | $139,600 | $22,500 | $117,100 |
Source: Public Records
Map
Nearby Homes
Your Personal Tour Guide
Ask me questions while you tour the home.