Estimated Value: $362,000 - $387,000
3
Beds
2
Baths
1,836
Sq Ft
$204/Sq Ft
Est. Value
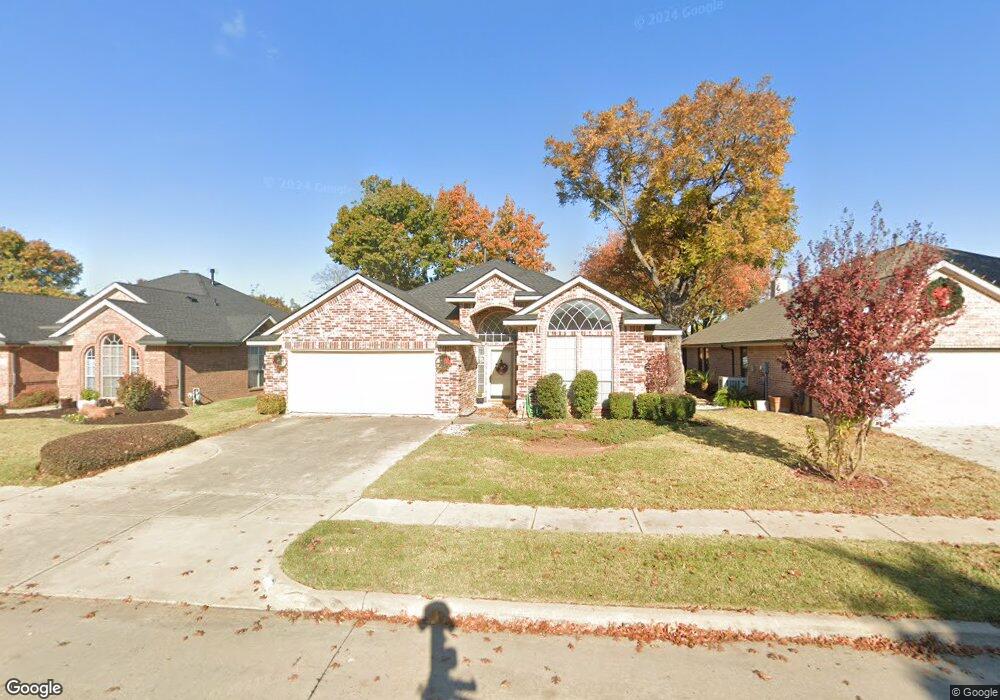
About This Home
This home is located at 308 Chantilly Ct, Hurst, TX 76054 and is currently estimated at $373,841, approximately $203 per square foot. 308 Chantilly Ct is a home located in Tarrant County with nearby schools including Shady Oaks Elementary School, Bedford Junior High School, and L.D. Bell High School.
Ownership History
Date
Name
Owned For
Owner Type
Purchase Details
Closed on
Aug 22, 2012
Sold by
Otoole Nyswomger Jerry L
Bought by
Brandon John H and Brandon Pamela D
Current Estimated Value
Home Financials for this Owner
Home Financials are based on the most recent Mortgage that was taken out on this home.
Original Mortgage
$123,750
Outstanding Balance
$84,999
Interest Rate
3.49%
Mortgage Type
New Conventional
Estimated Equity
$288,842
Purchase Details
Closed on
Jan 8, 2008
Sold by
Otoole David R
Bought by
Otoole Jerry L
Purchase Details
Closed on
Jul 28, 1998
Sold by
Classic Concepts Inc
Bought by
Otoole David R and Otoole Jerry
Home Financials for this Owner
Home Financials are based on the most recent Mortgage that was taken out on this home.
Original Mortgage
$71,900
Interest Rate
6.94%
Create a Home Valuation Report for This Property
The Home Valuation Report is an in-depth analysis detailing your home's value as well as a comparison with similar homes in the area
Home Values in the Area
Average Home Value in this Area
Purchase History
| Date | Buyer | Sale Price | Title Company |
|---|---|---|---|
| Brandon John H | -- | Lawyers Title | |
| Otoole Jerry L | -- | None Available | |
| Otoole David R | -- | Safeco Land Title |
Source: Public Records
Mortgage History
| Date | Status | Borrower | Loan Amount |
|---|---|---|---|
| Open | Brandon John H | $123,750 | |
| Previous Owner | Otoole David R | $71,900 |
Source: Public Records
Tax History
| Year | Tax Paid | Tax Assessment Tax Assessment Total Assessment is a certain percentage of the fair market value that is determined by local assessors to be the total taxable value of land and additions on the property. | Land | Improvement |
|---|---|---|---|---|
| 2025 | $7,937 | $358,000 | $71,250 | $286,750 |
| 2024 | $7,937 | $388,572 | $71,250 | $317,322 |
| 2023 | $7,394 | $369,050 | $38,000 | $331,050 |
| 2022 | $7,529 | $327,021 | $38,000 | $289,021 |
| 2021 | $6,103 | $253,061 | $38,000 | $215,061 |
| 2020 | $6,088 | $253,061 | $38,000 | $215,061 |
| 2019 | $6,194 | $253,061 | $38,000 | $215,061 |
| 2018 | $6,094 | $249,000 | $38,000 | $211,000 |
| 2017 | $5,162 | $204,000 | $40,000 | $164,000 |
| 2016 | $4,921 | $194,452 | $40,000 | $154,452 |
| 2015 | $4,419 | $168,500 | $25,000 | $143,500 |
| 2014 | $4,419 | $168,500 | $25,000 | $143,500 |
Source: Public Records
Map
Nearby Homes
- 404 Mountainview Dr
- 227 Norwich Dr
- 421 Cavender Ct
- 317 Northglen Dr
- 440 W Louella Dr
- 412 Elisha Dr
- 201 W Louella Dr
- 2204 Mountainview Dr
- 3006 Carolyn Ct
- 413 Baker Dr
- 137 E Louella Dr
- 200 Eagle Ct
- 617 Indian Trail
- 201 Hillview Dr
- 1913 Yucca Trail
- 2157 Lookout Ct
- 1761 Cynthia Ln
- 2244 Hurstview Dr
- 410 Carolyn Dr
- 2221 Farrington Ln
- 312 Chantilly Ct
- 304 Chantilly Ct
- 316 Chantilly Ct
- 300 Chantilly Ct
- 305 Mountainview Dr
- 309 Mountainview Dr
- 301 Mountainview Dr
- 309 Chantilly Ct
- 309 Chantilly Ct
- 320 Chantilly Ct
- 313 Chantilly Ct
- 305 Chantilly Ct
- 313 Mountainview Dr
- 301 Chantilly Ct
- 317 Chantilly Ct
- 324 Chantilly Ct
- 321 Chantilly Ct
- 317 Mountainview Dr
- 325 Chantilly Ct
- 247 Mountainview Dr
Your Personal Tour Guide
Ask me questions while you tour the home.