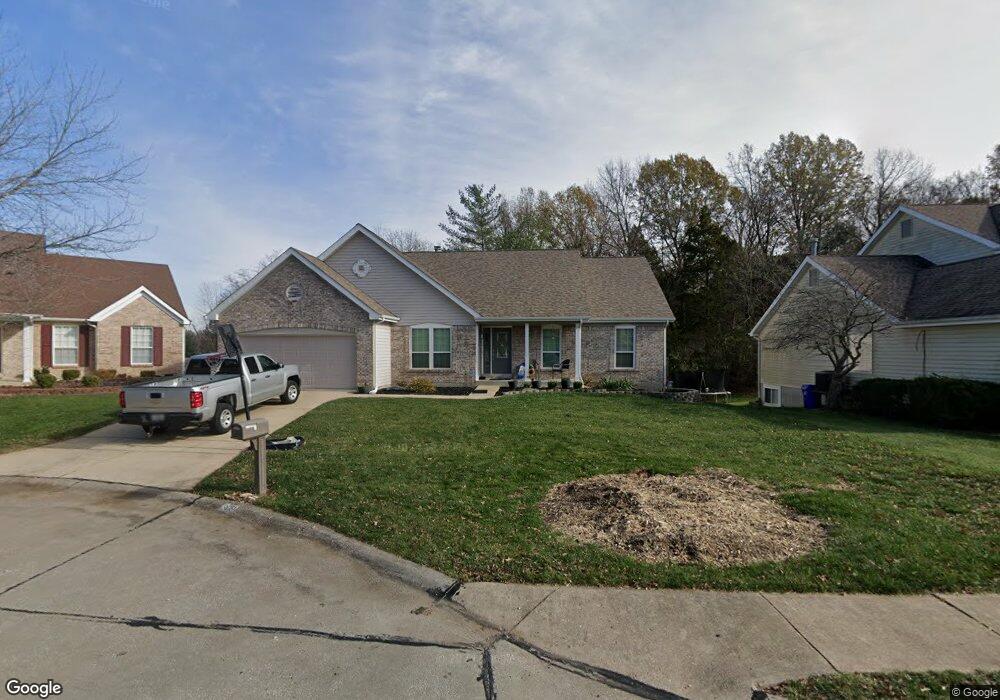
308 Charleston Oaks Ct Ballwin, MO 63021
Estimated Value: $500,217 - $546,000
3
Beds
2
Baths
2,024
Sq Ft
$259/Sq Ft
Est. Value
About This Home
This home is located at 308 Charleston Oaks Ct, Ballwin, MO 63021 and is currently estimated at $523,554, approximately $258 per square foot. 308 Charleston Oaks Ct is a home located in St. Louis County with nearby schools including Oak Brook Elementary School, Parkway Southwest Middle School, and Parkway South High School.
Ownership History
Date
Name
Owned For
Owner Type
Purchase Details
Closed on
May 23, 2022
Sold by
Inman Mary L
Bought by
Mary L Inman Revocable Living Trust
Current Estimated Value
Purchase Details
Closed on
May 31, 2002
Sold by
Brown Scott C
Bought by
Inman Mary L
Home Financials for this Owner
Home Financials are based on the most recent Mortgage that was taken out on this home.
Original Mortgage
$156,000
Interest Rate
6.89%
Purchase Details
Closed on
Dec 31, 2001
Sold by
Brown Scott C
Bought by
Brown Scott C
Purchase Details
Closed on
Feb 9, 2001
Sold by
Allen Schutzenhofer Edward and Allen Sheila D
Bought by
Brown Scott C
Home Financials for this Owner
Home Financials are based on the most recent Mortgage that was taken out on this home.
Original Mortgage
$201,000
Interest Rate
7.13%
Create a Home Valuation Report for This Property
The Home Valuation Report is an in-depth analysis detailing your home's value as well as a comparison with similar homes in the area
Home Values in the Area
Average Home Value in this Area
Purchase History
| Date | Buyer | Sale Price | Title Company |
|---|---|---|---|
| Mary L Inman Revocable Living Trust | -- | None Listed On Document | |
| Inman Mary L | $260,000 | -- | |
| Brown Scott C | -- | -- | |
| Brown Scott C | $254,000 | -- | |
| Brown Scott C | -- | -- |
Source: Public Records
Mortgage History
| Date | Status | Borrower | Loan Amount |
|---|---|---|---|
| Previous Owner | Inman Mary L | $156,000 | |
| Previous Owner | Brown Scott C | $201,000 |
Source: Public Records
Tax History Compared to Growth
Tax History
| Year | Tax Paid | Tax Assessment Tax Assessment Total Assessment is a certain percentage of the fair market value that is determined by local assessors to be the total taxable value of land and additions on the property. | Land | Improvement |
|---|---|---|---|---|
| 2025 | $5,134 | $90,540 | $34,810 | $55,730 |
| 2024 | $5,134 | $79,330 | $24,380 | $54,950 |
| 2023 | $5,062 | $79,330 | $24,380 | $54,950 |
| 2022 | $5,007 | $71,330 | $20,880 | $50,450 |
| 2021 | $4,978 | $71,330 | $20,880 | $50,450 |
| 2020 | $4,473 | $60,700 | $20,880 | $39,820 |
| 2019 | $4,422 | $60,700 | $20,880 | $39,820 |
| 2018 | $4,579 | $58,330 | $17,400 | $40,930 |
| 2017 | $4,448 | $58,330 | $17,400 | $40,930 |
| 2016 | $4,212 | $52,530 | $13,050 | $39,480 |
| 2015 | $4,409 | $52,530 | $13,050 | $39,480 |
| 2014 | $3,624 | $46,080 | $14,290 | $31,790 |
Source: Public Records
Map
Nearby Homes
- 118 Cascade Circle Dr
- 647 Cascade Lake Dr
- 178 Cascade Circle Dr
- 1152 Hollyberry Dr
- 728 Highland Glen Dr
- 935 Cleta Dr
- 237 Valleyoak Ct
- 334 Lauren Landing
- 264 Magnolia Trace Dr
- 436 Ries Rd
- 436 Far Hill Dr
- 370 Marywood Ct
- 418 Great Hill Dr
- 1231 Bedford Falls Ct
- 746 Woodside Trails Dr Unit B
- 1233 Red Oak Plantation Dr
- 740 Woodside Trails Dr Unit 103
- 1217 Kiefer Creek Rd
- 843 Whispering Village Cir
- 151 Holly Garden Dr
- 312 Charleston Oaks Ct
- 304 Charleston Oaks Ct
- 316 Charleston Oaks Ct
- 300 Charleston Oaks Ct
- 315 Charleston Oaks Ct
- 604 Charleston Oaks Dr
- 320 Charleston Oaks Ct
- 600 Charleston Oaks Dr
- 764 Charleston Oaks Dr
- 768 Charleston Oaks Dr
- 608 Charleston Oaks Dr
- 323 Charleston Oaks Ct
- 760 Charleston Oaks Dr
- 324 Charleston Oaks Ct
- 756 Charleston Oaks Dr
- 612 Charleston Oaks Dr
- 772 Charleston Oaks Dr
- 327 Charleston Oaks Ct
- 465 Wildflower Ct
- 328 Charleston Oaks Ct