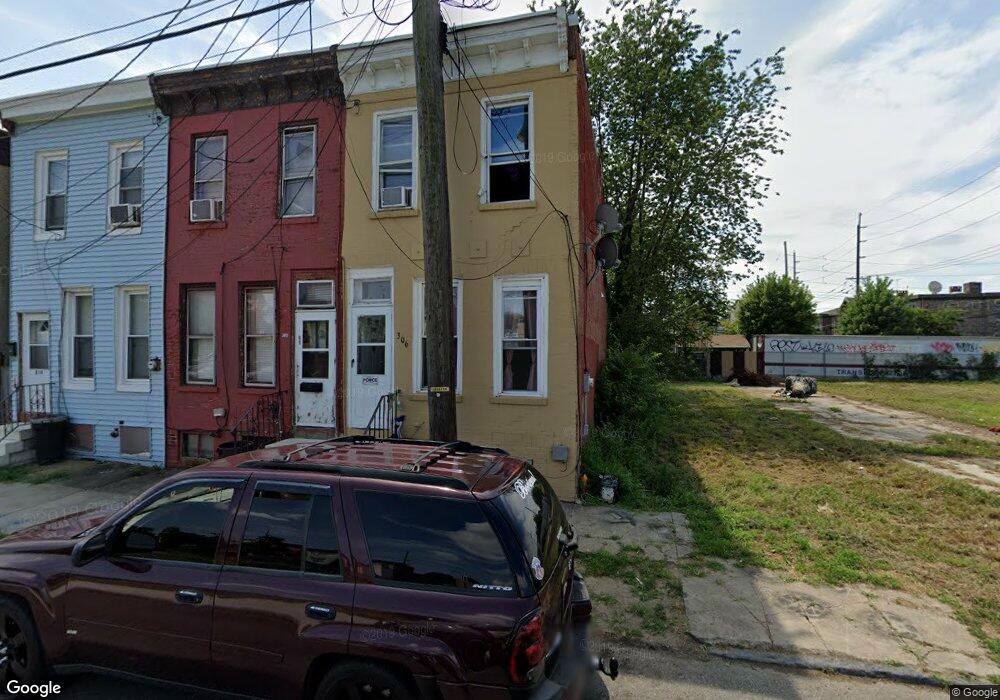
308 Cherry St Camden, NJ 08103
Bergen Square NeighborhoodEstimated Value: $85,151 - $187,000
Studio
--
Bath
1,056
Sq Ft
$134/Sq Ft
Est. Value
About This Home
This home is located at 308 Cherry St, Camden, NJ 08103 and is currently estimated at $141,288, approximately $133 per square foot. 308 Cherry St is a home located in Camden County with nearby schools including Camden High School, Hope Community Charter School, and Leap Academy University Charter School.
Ownership History
Date
Name
Owned For
Owner Type
Purchase Details
Closed on
Dec 22, 2025
Sold by
Gorman Charles A
Bought by
Ac 308 Cherry Investments Llc
Current Estimated Value
Home Financials for this Owner
Home Financials are based on the most recent Mortgage that was taken out on this home.
Original Mortgage
$118,500
Outstanding Balance
$108,905
Interest Rate
6.26%
Mortgage Type
Construction
Estimated Equity
$32,383
Purchase Details
Closed on
Jul 19, 2022
Sold by
Gorman Ruth M
Bought by
Gorman Charles A
Create a Home Valuation Report for This Property
The Home Valuation Report is an in-depth analysis detailing your home's value as well as a comparison with similar homes in the area
Home Values in the Area
Average Home Value in this Area
Purchase History
| Date | Buyer | Sale Price | Title Company |
|---|---|---|---|
| Ac 308 Cherry Investments Llc | $60,000 | American Title Abstract | |
| Gorman Charles A | -- | -- | |
| Gorman Charles A | -- | None Listed On Document |
Source: Public Records
Mortgage History
| Date | Status | Borrower | Loan Amount |
|---|---|---|---|
| Open | Ac 308 Cherry Investments Llc | $118,500 |
Source: Public Records
Tax History
| Year | Tax Paid | Tax Assessment Tax Assessment Total Assessment is a certain percentage of the fair market value that is determined by local assessors to be the total taxable value of land and additions on the property. | Land | Improvement |
|---|---|---|---|---|
| 2025 | $804 | $22,700 | $5,200 | $17,500 |
| 2024 | $777 | $22,700 | $5,200 | $17,500 |
| 2023 | $777 | $22,700 | $5,200 | $17,500 |
| 2022 | $763 | $22,700 | $5,200 | $17,500 |
| 2021 | $760 | $22,700 | $5,200 | $17,500 |
| 2020 | $722 | $22,700 | $5,200 | $17,500 |
| 2019 | $691 | $22,700 | $5,200 | $17,500 |
| 2018 | $688 | $22,700 | $5,200 | $17,500 |
| 2017 | $671 | $22,700 | $5,200 | $17,500 |
| 2016 | $426 | $14,900 | $5,200 | $9,700 |
| 2015 | $410 | $14,900 | $5,200 | $9,700 |
| 2014 | $401 | $14,900 | $5,200 | $9,700 |
Source: Public Records
Map
Nearby Homes
Your Personal Tour Guide
Ask me questions while you tour the home.