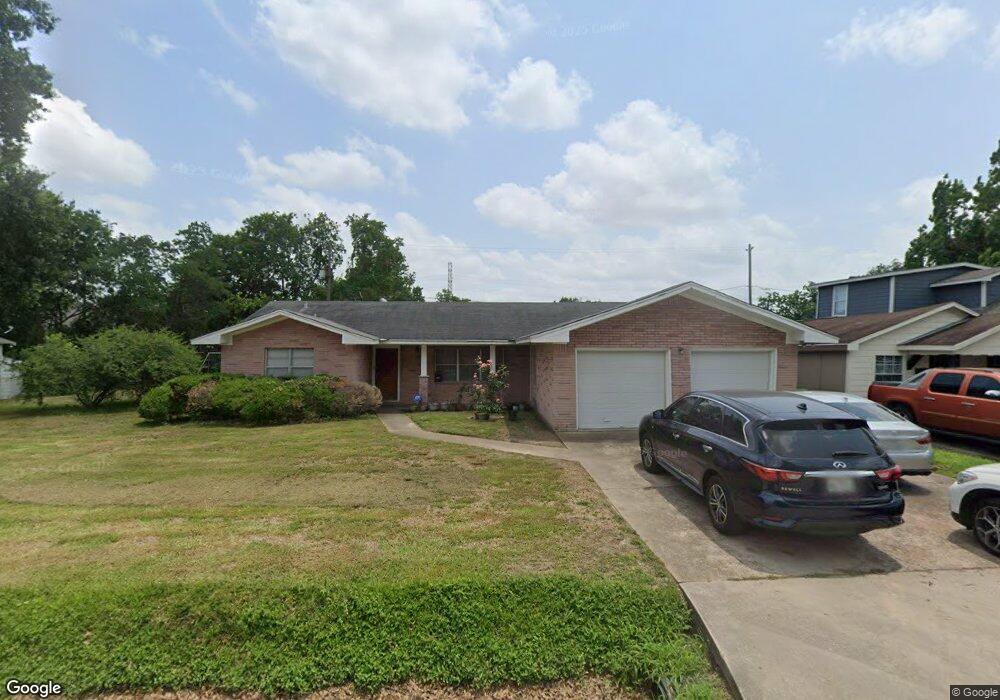
308 E 38th St Houston, TX 77018
Independence Heights NeighborhoodEstimated Value: $150,638 - $214,000
2
Beds
1
Bath
880
Sq Ft
$220/Sq Ft
Est. Value
About This Home
This home is located at 308 E 38th St, Houston, TX 77018 and is currently estimated at $193,160, approximately $219 per square foot. 308 E 38th St is a home located in Harris County with nearby schools including Burrus Elementary School, Williams Middle, and Booker T Washington Sr High.
Ownership History
Date
Name
Owned For
Owner Type
Purchase Details
Closed on
Jul 15, 2012
Sold by
Molina Martin
Bought by
Nieto Adelaida Diaz and Guzman Son Jose Antonio
Current Estimated Value
Purchase Details
Closed on
Mar 3, 2012
Sold by
Howard Michael
Bought by
Nieto Adelaide Diaz and Molina Martin
Purchase Details
Closed on
Jan 8, 2010
Sold by
Lights Ruben and Bowie Thelma Lights
Bought by
Taft Interests Inc
Create a Home Valuation Report for This Property
The Home Valuation Report is an in-depth analysis detailing your home's value as well as a comparison with similar homes in the area
Home Values in the Area
Average Home Value in this Area
Purchase History
| Date | Buyer | Sale Price | Title Company |
|---|---|---|---|
| Nieto Adelaida Diaz | -- | None Available | |
| Nieto Adelaide Diaz | -- | None Available | |
| Taft Interests Inc | -- | Old Republic Title Company O |
Source: Public Records
Tax History
| Year | Tax Paid | Tax Assessment Tax Assessment Total Assessment is a certain percentage of the fair market value that is determined by local assessors to be the total taxable value of land and additions on the property. | Land | Improvement |
|---|---|---|---|---|
| 2025 | $1,045 | $115,585 | $84,000 | $31,585 |
| 2024 | $1,045 | $108,021 | $84,000 | $24,021 |
| 2023 | $1,045 | $109,834 | $84,000 | $25,834 |
| 2022 | $1,038 | $97,035 | $72,000 | $25,035 |
| 2021 | $999 | $83,533 | $60,000 | $23,533 |
| 2020 | $944 | $75,290 | $60,000 | $15,290 |
| 2019 | $897 | $72,510 | $52,500 | $20,010 |
| 2018 | $77 | $63,864 | $45,000 | $18,864 |
| 2017 | $740 | $54,864 | $36,000 | $18,864 |
| 2016 | $673 | $42,864 | $24,000 | $18,864 |
| 2015 | $412 | $37,152 | $24,000 | $13,152 |
| 2014 | $412 | $22,000 | $15,000 | $7,000 |
Source: Public Records
Map
Nearby Homes
Your Personal Tour Guide
Ask me questions while you tour the home.