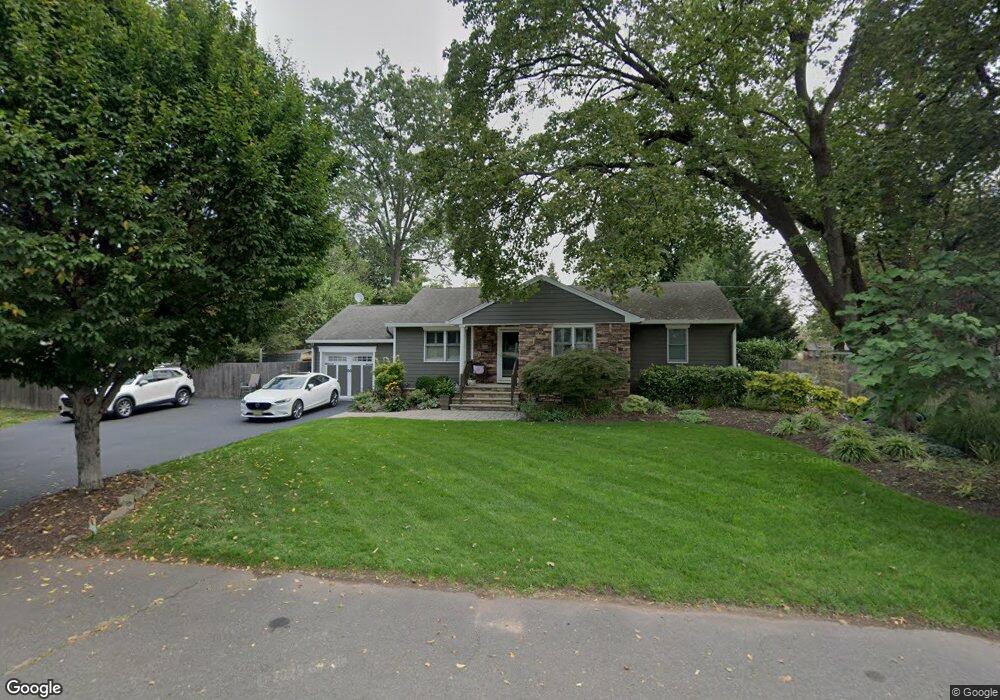
308 E St Middlesex, NJ 08846
Estimated Value: $532,207 - $623,000
Studio
--
Bath
1,510
Sq Ft
$379/Sq Ft
Est. Value
About This Home
This home is located at 308 E St, Middlesex, NJ 08846 and is currently estimated at $572,052, approximately $378 per square foot. 308 E St is a home located in Middlesex County with nearby schools including Middlesex High School, Our Lady of Mount Virgin School, and Green Brook Academy.
Ownership History
Date
Name
Owned For
Owner Type
Purchase Details
Closed on
Oct 14, 2003
Sold by
Zierdt Harry
Bought by
Wynkoop Thomas A and Wynkoop Karen L
Current Estimated Value
Home Financials for this Owner
Home Financials are based on the most recent Mortgage that was taken out on this home.
Original Mortgage
$160,000
Interest Rate
5.9%
Purchase Details
Closed on
Dec 2, 1996
Sold by
King Morrell
Bought by
Tarby Michel and Tarby Kristie
Home Financials for this Owner
Home Financials are based on the most recent Mortgage that was taken out on this home.
Original Mortgage
$137,000
Interest Rate
7.83%
Create a Home Valuation Report for This Property
The Home Valuation Report is an in-depth analysis detailing your home's value as well as a comparison with similar homes in the area
Home Values in the Area
Average Home Value in this Area
Purchase History
| Date | Buyer | Sale Price | Title Company |
|---|---|---|---|
| Wynkoop Thomas A | $275,000 | -- | |
| Tarby Michel | $171,000 | -- |
Source: Public Records
Mortgage History
| Date | Status | Borrower | Loan Amount |
|---|---|---|---|
| Previous Owner | Wynkoop Thomas A | $160,000 | |
| Previous Owner | Tarby Michel | $137,000 |
Source: Public Records
Tax History
| Year | Tax Paid | Tax Assessment Tax Assessment Total Assessment is a certain percentage of the fair market value that is determined by local assessors to be the total taxable value of land and additions on the property. | Land | Improvement |
|---|---|---|---|---|
| 2025 | $11,084 | $538,100 | $161,900 | $376,200 |
| 2024 | $10,552 | $479,000 | $161,900 | $317,100 |
| 2023 | $10,552 | $479,000 | $161,900 | $317,100 |
| 2022 | $11,177 | $113,000 | $39,200 | $73,800 |
| 2021 | $8,108 | $113,000 | $39,200 | $73,800 |
| 2020 | $10,647 | $113,000 | $39,200 | $73,800 |
| 2019 | $10,359 | $113,000 | $39,200 | $73,800 |
| 2018 | $10,045 | $113,000 | $39,200 | $73,800 |
| 2017 | $9,768 | $113,000 | $39,200 | $73,800 |
| 2016 | $9,446 | $113,000 | $39,200 | $73,800 |
| 2015 | $9,246 | $113,000 | $39,200 | $73,800 |
| 2014 | $9,069 | $113,000 | $39,200 | $73,800 |
Source: Public Records
Map
Nearby Homes
- 531 Chestnut St
- 311 Chestnut St
- 216 Chestnut St
- 230 Melrose Ave
- 116 Greene Ave
- 303 Ashland Rd
- 407 Clinton Ave
- 151 Beechwood Ave
- 134 Benart Place
- 101 Lorraine Ave
- 315 East St
- 112 East St
- 310 Howard Ave
- 105 Swing Bridge Ln Unit 1009
- 408 E Union Ave
- 8 Swing Bridge Ln Unit 904
- 212 Vesper Ave
- 730 Park Ave
- 589 Mountain Ave
- 531 Harris Ave
Your Personal Tour Guide
Ask me questions while you tour the home.