Estimated Value: $448,000 - $465,219
4
Beds
3
Baths
2,917
Sq Ft
$157/Sq Ft
Est. Value
About This Home
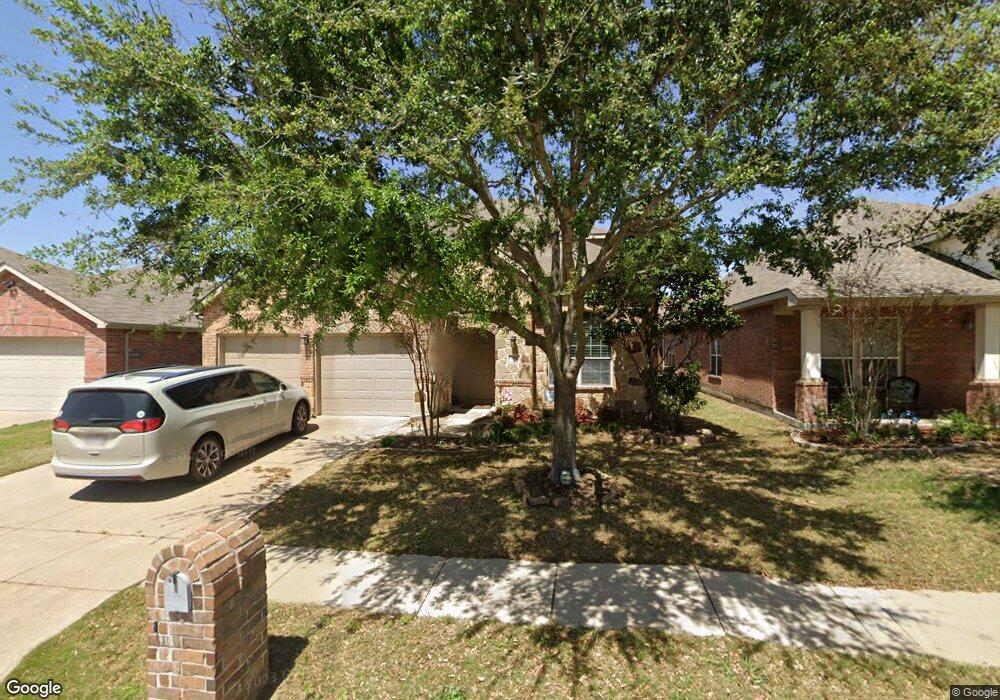
This home is located at 308 Fairland Dr, Wylie, TX 75098 and is currently estimated at $456,555, approximately $156 per square foot. 308 Fairland Dr is a home located in Collin County with nearby schools including Cheri Cox Elementary School, AB Harrison Intermediate School, and Grady Burnett J High School.
Ownership History
Date
Name
Owned For
Owner Type
Purchase Details
Closed on
Aug 1, 2018
Sold by
Fontenot Kelley and Fontenot Terry
Bought by
Baack Erric R and Baack Julie E
Current Estimated Value
Home Financials for this Owner
Home Financials are based on the most recent Mortgage that was taken out on this home.
Original Mortgage
$246,000
Outstanding Balance
$213,641
Interest Rate
4.5%
Mortgage Type
New Conventional
Estimated Equity
$242,914
Purchase Details
Closed on
Feb 20, 2015
Sold by
Selman Rangel Bess A and Rangel Joshua D
Bought by
Fontenot Kelley and Fontenot Terry
Home Financials for this Owner
Home Financials are based on the most recent Mortgage that was taken out on this home.
Original Mortgage
$230,850
Interest Rate
3.68%
Mortgage Type
New Conventional
Purchase Details
Closed on
May 30, 2008
Sold by
Horizon Homes Ltd
Bought by
Selman Rangel Bess A and Rangel Joshua D
Home Financials for this Owner
Home Financials are based on the most recent Mortgage that was taken out on this home.
Original Mortgage
$194,750
Interest Rate
5.89%
Mortgage Type
Purchase Money Mortgage
Create a Home Valuation Report for This Property
The Home Valuation Report is an in-depth analysis detailing your home's value as well as a comparison with similar homes in the area
Home Values in the Area
Average Home Value in this Area
Purchase History
| Date | Buyer | Sale Price | Title Company |
|---|---|---|---|
| Baack Erric R | -- | Rattikin Title | |
| Fontenot Kelley | -- | Rtt | |
| Selman Rangel Bess A | -- | None Available |
Source: Public Records
Mortgage History
| Date | Status | Borrower | Loan Amount |
|---|---|---|---|
| Open | Baack Erric R | $246,000 | |
| Previous Owner | Fontenot Kelley | $230,850 | |
| Previous Owner | Selman Rangel Bess A | $194,750 |
Source: Public Records
Tax History Compared to Growth
Tax History
| Year | Tax Paid | Tax Assessment Tax Assessment Total Assessment is a certain percentage of the fair market value that is determined by local assessors to be the total taxable value of land and additions on the property. | Land | Improvement |
|---|---|---|---|---|
| 2025 | $9,045 | $437,098 | $110,000 | $327,098 |
| 2024 | $9,045 | $457,944 | $110,000 | $347,944 |
| 2023 | $9,045 | $439,823 | $90,000 | $349,823 |
| 2022 | $8,859 | $403,781 | $90,000 | $313,781 |
| 2021 | $7,446 | $316,453 | $60,000 | $256,453 |
| 2020 | $7,387 | $297,514 | $60,000 | $237,514 |
| 2019 | $7,934 | $301,919 | $60,000 | $241,919 |
| 2018 | $7,698 | $285,846 | $60,000 | $225,846 |
| 2017 | $7,408 | $275,090 | $55,000 | $220,090 |
| 2016 | $7,017 | $252,533 | $50,000 | $202,533 |
| 2015 | $5,647 | $237,860 | $44,000 | $193,860 |
Source: Public Records
Map
Nearby Homes
- 301 Highland Park Ln
- 319 Highland View Dr
- 412 Highland Ridge Dr
- 217 Champion
- 1905 Fairway Crossing Rd
- 206 Covington Dr
- 123 Monarch Way
- 2014 Fairway Woods Dr
- 212 Colonial Dr
- 528 Highland Ridge Dr
- 308 Parke Hollow Dr
- 100 Lavender Ln
- 303 Parke Lake Dr
- 807 Crescent Way
- 102 Autumn Sage Dr
- 103 Cascade Ln
- 107 Lantana Ln
- 322 Hogue Ln
- 109 Rockbrook Dr
- 506 Hemlock Ct
- 310 Fairland Dr
- 304 Fairland Dr
- 312 Fairland Dr
- 309 Highland Park Ln
- 307 Highland Park Ln
- 311 Highland Park Ln
- 302 Fairland Dr
- 305 Highland Park Ln
- 313 Highland Park Ln
- 314 Fairland Dr
- 323 Fairland Dr
- 325 Fairland Dr
- 321 Fairland Dr
- 303 Highland Park Ln
- 319 Fairland Dr
- 327 Fairland Dr
- 315 Highland Park Ln
- 300 Fairland Dr
- 317 Fairland Dr
- 329 Fairland Dr