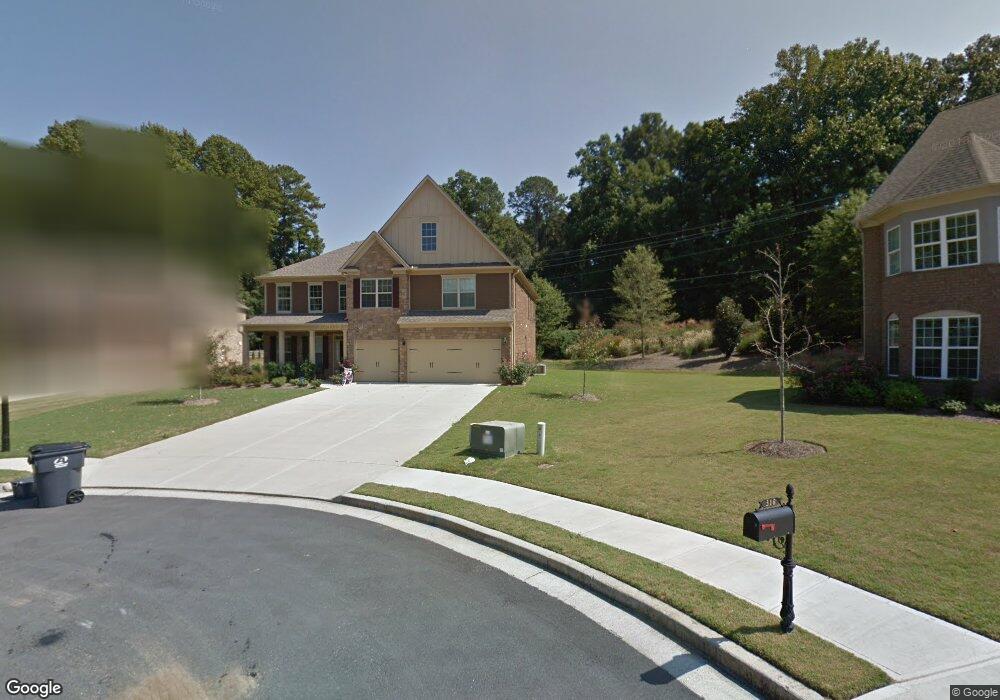
308 Field House Cir SW Lilburn, GA 30047
Estimated Value: $597,496 - $663,000
5
Beds
4
Baths
3,633
Sq Ft
$174/Sq Ft
Est. Value
About This Home
This home is located at 308 Field House Cir SW, Lilburn, GA 30047 and is currently estimated at $632,624, approximately $174 per square foot. 308 Field House Cir SW is a home located in Gwinnett County with nearby schools including Camp Creek Elementary School, Trickum Middle School, and Parkview High School.
Ownership History
Date
Name
Owned For
Owner Type
Purchase Details
Closed on
Jan 2, 2021
Sold by
Memon Shahidabanu
Bought by
Memon Shahida Gulam and Shahida Gulam Memom Family Rev
Current Estimated Value
Purchase Details
Closed on
Jan 8, 2019
Sold by
Memon Shahidabanu
Bought by
Ebrahim Memon Shahidabanu and Ebrahim Nana Khadija
Purchase Details
Closed on
Mar 31, 2014
Sold by
Saleem Muhammad
Bought by
Memon Shahidabanu
Home Financials for this Owner
Home Financials are based on the most recent Mortgage that was taken out on this home.
Original Mortgage
$265,001
Interest Rate
4.4%
Mortgage Type
New Conventional
Purchase Details
Closed on
Dec 29, 2011
Sold by
Dr Horton Inc
Bought by
Saleem Muhammad and Saleem Nafisa
Create a Home Valuation Report for This Property
The Home Valuation Report is an in-depth analysis detailing your home's value as well as a comparison with similar homes in the area
Home Values in the Area
Average Home Value in this Area
Purchase History
| Date | Buyer | Sale Price | Title Company |
|---|---|---|---|
| Memon Shahida Gulam | -- | -- | |
| Ebrahim Memon Shahidabanu | -- | -- | |
| Memon Shahidabanu | $311,766 | -- | |
| Saleem Muhammad | $311,766 | -- |
Source: Public Records
Mortgage History
| Date | Status | Borrower | Loan Amount |
|---|---|---|---|
| Previous Owner | Memon Shahidabanu | $265,001 |
Source: Public Records
Tax History Compared to Growth
Tax History
| Year | Tax Paid | Tax Assessment Tax Assessment Total Assessment is a certain percentage of the fair market value that is determined by local assessors to be the total taxable value of land and additions on the property. | Land | Improvement |
|---|---|---|---|---|
| 2025 | $6,224 | $245,360 | $44,120 | $201,240 |
| 2024 | $5,718 | $212,440 | $31,600 | $180,840 |
| 2023 | $5,718 | $212,440 | $31,600 | $180,840 |
| 2022 | $5,732 | $212,440 | $31,600 | $180,840 |
| 2021 | $4,952 | $169,040 | $31,600 | $137,440 |
| 2020 | $5,898 | $169,040 | $31,600 | $137,440 |
| 2019 | $5,883 | $169,040 | $31,600 | $137,440 |
| 2018 | $5,906 | $169,040 | $31,600 | $137,440 |
| 2016 | $4,729 | $124,680 | $25,600 | $99,080 |
| 2015 | $4,781 | $124,680 | $25,600 | $99,080 |
| 2014 | -- | $125,960 | $25,600 | $100,360 |
Source: Public Records
Map
Nearby Homes
- 4484 Francis Ct SW
- 146 King David Dr SW
- 4358 Louis Rd SW
- 4627 Nantucket Dr SW
- 383 Ben Ave SW
- 4740 Nantucket Dr SW
- The Tyndall Plan at Annsbury Park
- The Maisie II Plan at Annsbury Park
- The Sadler Plan at Annsbury Park
- The Talbot Plan at Annsbury Park
- The Idlewild Plan at Annsbury Park
- 4909 Woodfall Dr SW
- 4160 Tillrock Ln
- 4181 Tillrock Ln
- 4151 Tillrock Ln
- 4171 Tillrock Ln
- 4191 Tillrock Ln
- 4131 Tillrock Ln
- 4239 River Branch Way
- 311 Arbor Point Ct SW
- 303 Field House Cir SW
- 318 Fieldhouse
- 318 Field House Cir SW
- 260 Village Green Ct SW
- 4541 Arcado Rd SW
- 328 Field House Cir SW
- 290 Village Green Ct SW
- 310 Village Green Ct SW
- 250 Village Green Ct SW
- 4558 Arcado Rd SW
- 240 Village Green Ct SW
- 241 Village Green Ct SW
- 320 Village Green Ct SW
- 271 Village Green Ct SW
- 4531 Arcado Rd SW
- 4592 Orange Jungle Way SW
- 4599 Orange Jungle Way SW
- 311 Village Green Ct SW
- 230 Village Green Ct SW
- 330 Village Green Ct SW