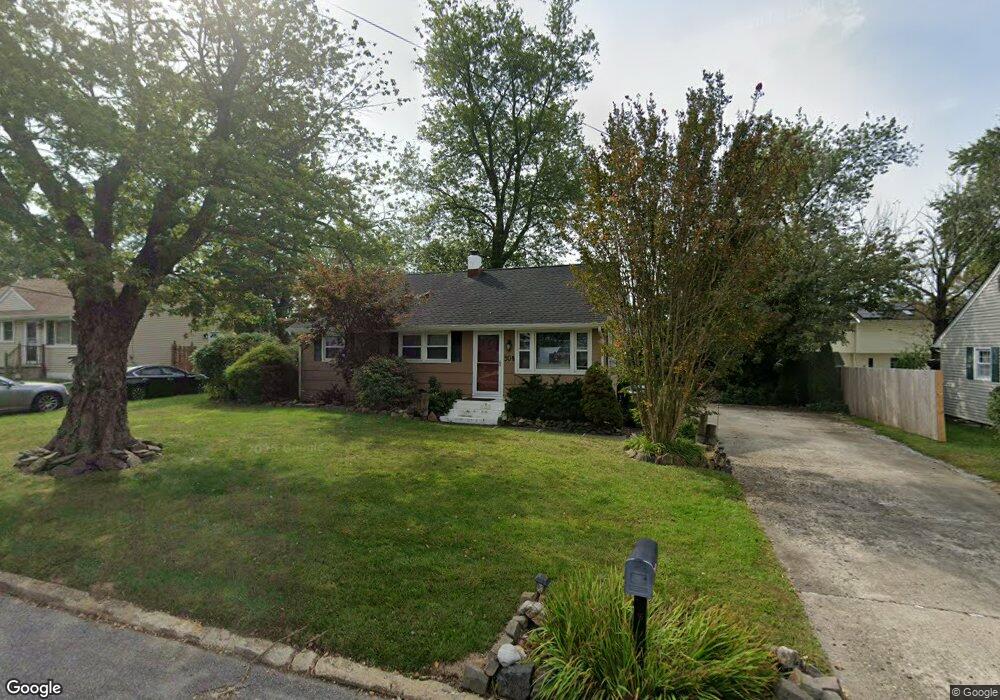
308 Hemlock Dr Neptune, NJ 07753
Estimated Value: $403,000 - $492,652
3
Beds
1
Bath
952
Sq Ft
$483/Sq Ft
Est. Value
About This Home
This home is located at 308 Hemlock Dr, Neptune, NJ 07753 and is currently estimated at $460,163, approximately $483 per square foot. 308 Hemlock Dr is a home located in Monmouth County with nearby schools including Neptune High School.
Ownership History
Date
Name
Owned For
Owner Type
Purchase Details
Closed on
Nov 10, 2023
Sold by
Smith Daniel
Bought by
Smith Daniel and Jones Jennifer
Current Estimated Value
Purchase Details
Closed on
May 5, 2009
Sold by
Deutsche Bank National Trust Company
Bought by
Smith Daniel
Home Financials for this Owner
Home Financials are based on the most recent Mortgage that was taken out on this home.
Original Mortgage
$187,728
Interest Rate
4.83%
Mortgage Type
FHA
Create a Home Valuation Report for This Property
The Home Valuation Report is an in-depth analysis detailing your home's value as well as a comparison with similar homes in the area
Home Values in the Area
Average Home Value in this Area
Purchase History
| Date | Buyer | Sale Price | Title Company |
|---|---|---|---|
| Smith Daniel | -- | Foundation Title | |
| Redacted Upon Request | -- | Foundation Title | |
| Smith Daniel | $205,000 | Magellan Title & Abstract Ll |
Source: Public Records
Mortgage History
| Date | Status | Borrower | Loan Amount |
|---|---|---|---|
| Previous Owner | Smith Daniel | $187,728 |
Source: Public Records
Tax History Compared to Growth
Tax History
| Year | Tax Paid | Tax Assessment Tax Assessment Total Assessment is a certain percentage of the fair market value that is determined by local assessors to be the total taxable value of land and additions on the property. | Land | Improvement |
|---|---|---|---|---|
| 2025 | $6,438 | $455,200 | $280,000 | $175,200 |
| 2024 | $6,135 | $367,700 | $221,000 | $146,700 |
| 2023 | $6,135 | $339,700 | $196,400 | $143,300 |
| 2022 | $5,576 | $295,100 | $168,800 | $126,300 |
| 2021 | $5,729 | $263,900 | $166,800 | $97,100 |
| 2020 | $5,780 | $272,900 | $180,800 | $92,100 |
| 2019 | $5,729 | $267,100 | $180,800 | $86,300 |
| 2018 | $5,060 | $233,200 | $147,500 | $85,700 |
| 2017 | $5,126 | $226,900 | $147,500 | $79,400 |
| 2016 | $5,212 | $230,100 | $152,500 | $77,600 |
| 2015 | $5,082 | $228,200 | $152,500 | $75,700 |
| 2014 | $5,123 | $189,100 | $122,500 | $66,600 |
Source: Public Records
Map
Nearby Homes
- 26 Pinebrook Dr
- 149 Wembley Way
- Regal Plan at Ironworks Crossings
- 17 Elm Dr
- 11 Elm Dr
- 1009 Old Corlies Ave
- Crofton Plan at Jumping Brook - The Enclave
- Taylor Plan at Jumping Brook - The Enclave
- 9 Jeanne Dr
- 4 Elm Dr
- 60 Penny Ln
- 66 Penny Ln
- 64 Penny Ln
- 62 Penny Ln
- 58 Penny Ln
- 56 Penny Ln
- 43 Victoria Gardens Square
- 33 Victoria Gardens Square
- 27 Victoria Gardens Square
- 24 Victoria Gardens Square