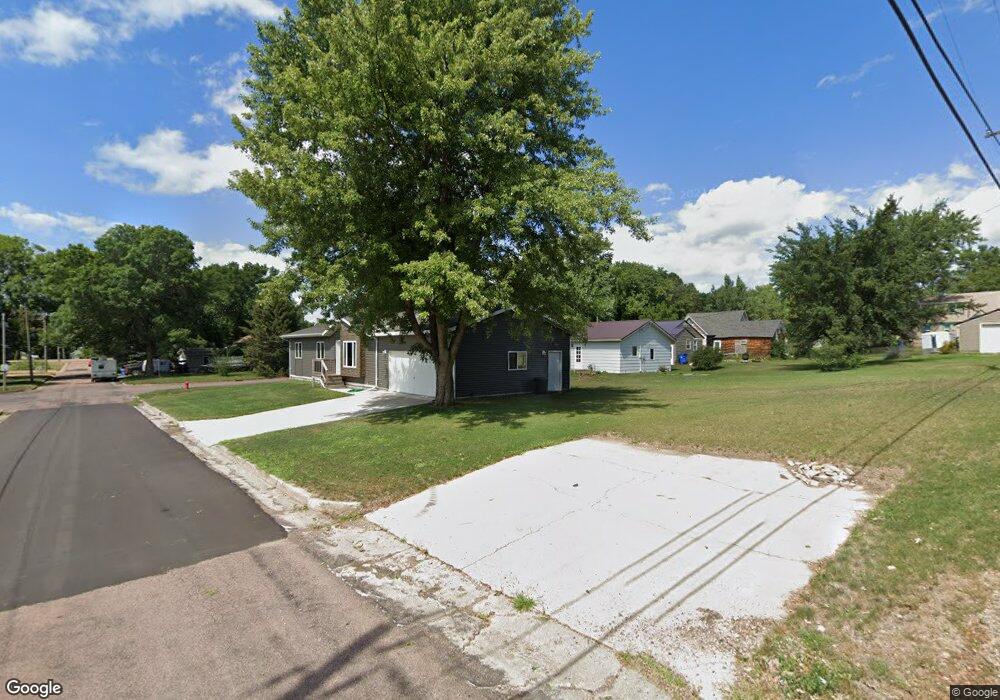
308 Iowa St Alcester, SD 57001
Estimated Value: $184,000 - $233,000
4
Beds
2
Baths
1,614
Sq Ft
$125/Sq Ft
Est. Value
About This Home
This home is located at 308 Iowa St, Alcester, SD 57001 and is currently estimated at $201,334, approximately $124 per square foot. 308 Iowa St is a home located in Union County with nearby schools including Alcester-Hudson Elementary School and Alcester-Hudson Junior High School.
Ownership History
Date
Name
Owned For
Owner Type
Purchase Details
Closed on
Feb 5, 2021
Sold by
Glas Thomas F and Glas Linda A
Bought by
Coenen Jeremiah R and Coenen Melissa
Current Estimated Value
Home Financials for this Owner
Home Financials are based on the most recent Mortgage that was taken out on this home.
Original Mortgage
$127,500
Outstanding Balance
$113,573
Interest Rate
2.6%
Mortgage Type
New Conventional
Estimated Equity
$87,761
Create a Home Valuation Report for This Property
The Home Valuation Report is an in-depth analysis detailing your home's value as well as a comparison with similar homes in the area
Purchase History
| Date | Buyer | Sale Price | Title Company |
|---|---|---|---|
| Coenen Jeremiah R | $150,000 | None Available |
Source: Public Records
Mortgage History
| Date | Status | Borrower | Loan Amount |
|---|---|---|---|
| Open | Coenen Jeremiah R | $127,500 |
Source: Public Records
Tax History
| Year | Tax Paid | Tax Assessment Tax Assessment Total Assessment is a certain percentage of the fair market value that is determined by local assessors to be the total taxable value of land and additions on the property. | Land | Improvement |
|---|---|---|---|---|
| 2025 | $2,573 | $158,066 | $12,582 | $145,484 |
| 2024 | $2,648 | $136,993 | $10,485 | $126,508 |
| 2023 | $2,265 | $122,497 | $7,490 | $115,007 |
| 2022 | $2,066 | $108,313 | $5,350 | $102,963 |
| 2021 | $1,705 | $92,388 | $4,652 | $87,736 |
| 2020 | $1,634 | $75,599 | $4,652 | $70,947 |
| 2019 | $2,125 | $80,368 | $4,652 | $75,716 |
| 2018 | $1,468 | $68,012 | $4,652 | $63,360 |
| 2017 | $1,384 | $68,012 | $0 | $68,012 |
| 2016 | $1,468 | $68,012 | $0 | $68,012 |
| 2015 | $1,468 | $68,012 | $0 | $68,012 |
| 2014 | $1,394 | $62,255 | $0 | $62,255 |
| 2013 | $1,364 | $62,255 | $0 | $62,255 |
| 2012 | $1,364 | $62,255 | $4,652 | $57,603 |
Source: Public Records
Map
Nearby Homes
- 303 Lincoln Dr
- 514 Anderson St
- 513 Beck Dr
- 110 Sd Hwy Hwy Unit 11
- 30224 477th Ave
- 47608 300th St
- 48201 304th St St
- 47418 301st St
- 2500 Avenue B
- 1127 Avenue F
- 1115 Central Ave
- 1302 Central Ave
- 917 Avenue I
- 905 Avenue K
- 112 Central Ave
- 1220 Avenue L
- 201 W Willow St
- 309 S 1st St
- 600 S 3rd St
- 200 S 3rd St
Your Personal Tour Guide
Ask me questions while you tour the home.