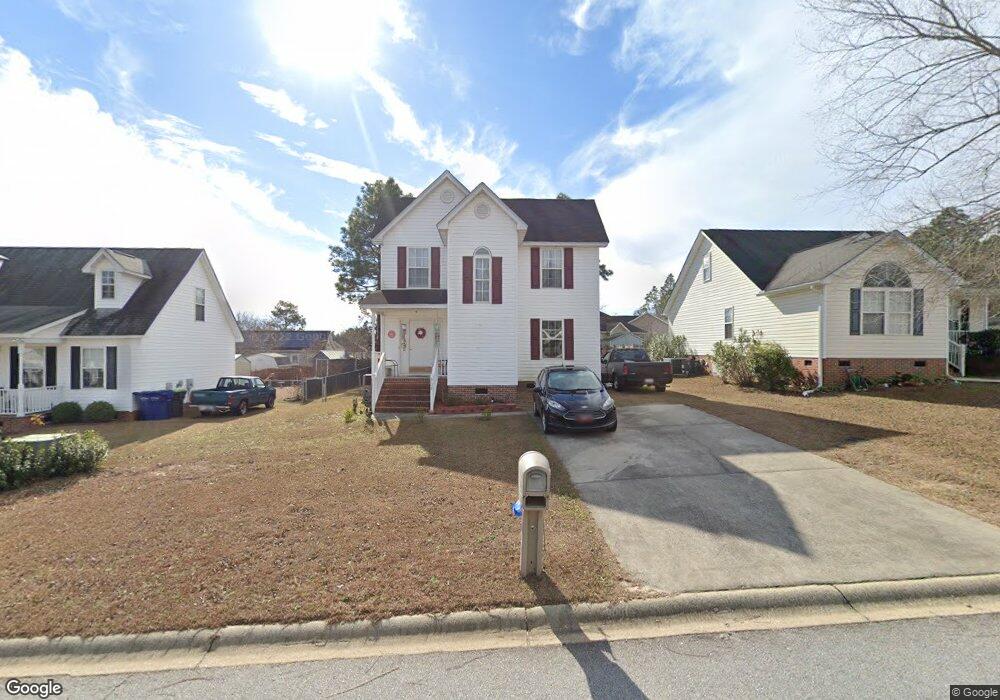
308 Louisa Ln Lexington, SC 29073
Estimated Value: $211,000 - $221,000
3
Beds
2
Baths
1,350
Sq Ft
$160/Sq Ft
Est. Value
About This Home
This home is located at 308 Louisa Ln, Lexington, SC 29073 and is currently estimated at $216,664, approximately $160 per square foot. 308 Louisa Ln is a home located in Lexington County with nearby schools including Saxe Gotha Elementary School, White Knoll Middle School, and White Knoll High School.
Ownership History
Date
Name
Owned For
Owner Type
Purchase Details
Closed on
Jan 8, 2020
Sold by
B & K Bassett Llc
Bought by
Mellette Curtis R and Mellette Sheila
Current Estimated Value
Home Financials for this Owner
Home Financials are based on the most recent Mortgage that was taken out on this home.
Original Mortgage
$126,678
Outstanding Balance
$112,247
Interest Rate
3.75%
Mortgage Type
FHA
Estimated Equity
$104,417
Purchase Details
Closed on
Jul 29, 2013
Sold by
South Carolina State Housing Finance & A
Bought by
B & K Bassett Llc
Purchase Details
Closed on
Jan 15, 2013
Sold by
Snipes Daniel C
Bought by
South Carolina State Housing Finance & D
Purchase Details
Closed on
Mar 31, 2008
Sold by
Faircloth Christopher A
Bought by
Snipes Daniel C
Home Financials for this Owner
Home Financials are based on the most recent Mortgage that was taken out on this home.
Original Mortgage
$2,000
Interest Rate
5.97%
Mortgage Type
Negative Amortization
Create a Home Valuation Report for This Property
The Home Valuation Report is an in-depth analysis detailing your home's value as well as a comparison with similar homes in the area
Home Values in the Area
Average Home Value in this Area
Purchase History
| Date | Buyer | Sale Price | Title Company |
|---|---|---|---|
| Mellette Curtis R | $135,000 | None Available | |
| B & K Bassett Llc | $87,000 | -- | |
| South Carolina State Housing Finance & D | $500 | -- | |
| Snipes Daniel C | $114,900 | Attorney |
Source: Public Records
Mortgage History
| Date | Status | Borrower | Loan Amount |
|---|---|---|---|
| Open | Mellette Curtis R | $126,678 | |
| Previous Owner | Snipes Daniel C | $2,000 | |
| Previous Owner | Snipes Daniel C | $98,400 |
Source: Public Records
Tax History Compared to Growth
Tax History
| Year | Tax Paid | Tax Assessment Tax Assessment Total Assessment is a certain percentage of the fair market value that is determined by local assessors to be the total taxable value of land and additions on the property. | Land | Improvement |
|---|---|---|---|---|
| 2024 | $384 | $5,400 | $1,000 | $4,400 |
| 2023 | $384 | $5,400 | $1,000 | $4,400 |
| 2022 | $392 | $5,400 | $1,000 | $4,400 |
| 2020 | $3,371 | $7,032 | $1,500 | $5,532 |
| 2019 | $2,816 | $5,682 | $1,020 | $4,662 |
| 2018 | $2,885 | $5,862 | $1,200 | $4,662 |
| 2017 | $2,837 | $5,862 | $1,200 | $4,662 |
| 2016 | $2,749 | $5,862 | $1,200 | $4,662 |
| 2014 | $2,970 | $6,833 | $1,200 | $5,633 |
| 2013 | -- | $6,830 | $1,200 | $5,630 |
Source: Public Records
Map
Nearby Homes
- 108 Tylers Trail
- 201 Hallie Hills Place
- 180 Tylers Trail
- 0 Wise Field Ln
- 491 Sandy Springs Ln
- 1668 Farshaw Way
- 1270 Old Orangeburg Rd
- 222 Farmdale Dr
- 314 Roland Dr
- 242 State Road S-32-1453
- 320 State House Ct
- 159 Weaver Dr
- 202A Fields Ln
- 202 Fields Ln
- 204 Walnut Creek Cir
- 2016 Old Barnwell Rd
- 1726 S Lake Dr
- 128 Sandy Springs Ln
- 138 A,B,C,D Benjamin Dr
- 1607 S Lake Dr
- 312 Louisa Ln
- 304 Louisa Ln
- 109 Tylers Trail
- 300 Louisa Ln
- 105 Tylers Trail
- 316 Louisa Ln
- 113 Tylers Trail
- 309 Louisa Ln
- 313 Louisa Ln
- 117 Tylers Trail
- 248 Louisa Ln
- 320 Louisa Ln
- 117 Tylers Trail
- 305 Louisa Ln
- 101 Tylers Trail
- 301 Louisa Ln
- 121 Tylers Trail
- 321 Louisa Ln
- 324 Louisa Ln
- 100 Tylers Trail