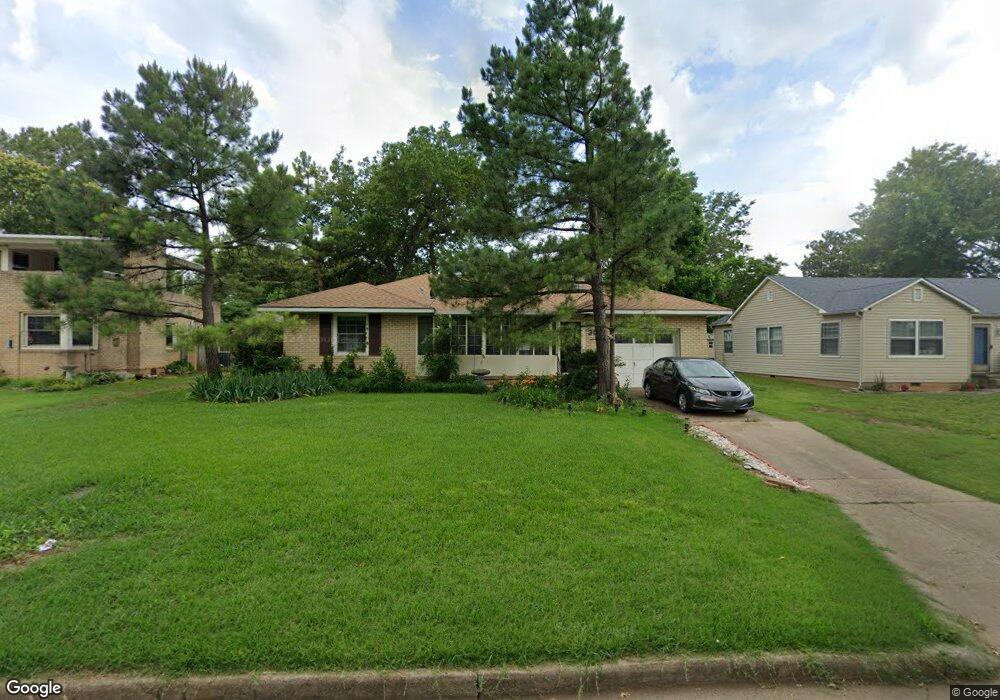
308 N 11th St Ponca City, OK 74601
Estimated Value: $117,906 - $128,000
2
Beds
2
Baths
1,355
Sq Ft
$91/Sq Ft
Est. Value
About This Home
This home is located at 308 N 11th St, Ponca City, OK 74601 and is currently estimated at $122,727, approximately $90 per square foot. 308 N 11th St is a home located in Kay County with nearby schools including Roosevelt Elementary School, Ponca City East Middle School, and Ponca City West Middle School.
Ownership History
Date
Name
Owned For
Owner Type
Purchase Details
Closed on
Dec 15, 2023
Sold by
Ventura Veronica L
Bought by
Veronica L Ventura Intervivos Trust and Ventura
Current Estimated Value
Purchase Details
Closed on
Aug 12, 2022
Sold by
Ventura Veronica L
Bought by
Veronica L Ventura Living Trust
Purchase Details
Closed on
May 14, 2021
Sold by
Monsour Dane A and Monsour Dane A
Bought by
Ventura Veronica
Home Financials for this Owner
Home Financials are based on the most recent Mortgage that was taken out on this home.
Original Mortgage
$89,775
Interest Rate
3.1%
Mortgage Type
New Conventional
Purchase Details
Closed on
Jul 11, 2013
Sold by
Monsour Dane A
Bought by
The Dane A Monsour Revocable Living Trus and Monsour Dane A
Purchase Details
Closed on
Apr 13, 1994
Sold by
Alice Spoon Alvin J Rich
Bought by
Dane A Mosour
Create a Home Valuation Report for This Property
The Home Valuation Report is an in-depth analysis detailing your home's value as well as a comparison with similar homes in the area
Home Values in the Area
Average Home Value in this Area
Purchase History
| Date | Buyer | Sale Price | Title Company |
|---|---|---|---|
| Veronica L Ventura Intervivos Trust | -- | None Listed On Document | |
| Ventura Veronica L | -- | None Listed On Document | |
| Veronica L Ventura Living Trust | -- | None Listed On Document | |
| Ventura Veronica | $94,500 | None Available | |
| The Dane A Monsour Revocable Living Trus | -- | None Available | |
| Dane A Mosour | $35,700 | -- |
Source: Public Records
Mortgage History
| Date | Status | Borrower | Loan Amount |
|---|---|---|---|
| Previous Owner | Ventura Veronica | $89,775 |
Source: Public Records
Tax History Compared to Growth
Tax History
| Year | Tax Paid | Tax Assessment Tax Assessment Total Assessment is a certain percentage of the fair market value that is determined by local assessors to be the total taxable value of land and additions on the property. | Land | Improvement |
|---|---|---|---|---|
| 2024 | $919 | $10,707 | $616 | $10,091 |
| 2023 | $919 | $10,707 | $658 | $10,049 |
| 2022 | $894 | $10,395 | $658 | $9,737 |
| 2021 | $596 | $6,234 | $658 | $5,576 |
| 2020 | $587 | $6,202 | $658 | $5,544 |
| 2019 | $564 | $5,907 | $658 | $5,249 |
| 2018 | $563 | $5,818 | $658 | $5,160 |
| 2017 | $570 | $5,818 | $658 | $5,160 |
| 2016 | $576 | $5,818 | $658 | $5,160 |
| 2015 | $569 | $5,719 | $658 | $5,061 |
| 2014 | $459 | $5,705 | $658 | $5,047 |
Source: Public Records
Map
Nearby Homes
- 216 N 12th St Unit 840
- 213 N 10th St
- 410 Drake Dr
- 525 Monument Rd
- 310 N 7th St Unit 660
- 202 N 7th St
- 409 N 5th St
- 310 S 9th St
- 214 Virginia Ave
- 417 N 3rd St
- 106 Elmwood Ave
- 800 Sugar Maple Dr
- 121 Hillside Ave
- 701 S 8th St
- 408 S 4th St
- 800 S 12th St
- 920 N 4th St
- 1013 N 7th St
- 734 E Albany Ave
- 212 E Ponca Ave
- 304 N 11th St
- 309 N 10th St
- 400 N 11th St Unit 840
- 305 N 10th St
- 300 N 11th St
- 313 N 10th St
- 309 N 11th St
- 313 N 11th St
- 305 N 11th St Unit 840
- 401 N 10th St Unit 840
- 301 N 10th St
- 404 N 11th St
- 401 N 11th St Unit 840
- 301 N 11th St Unit 840
- 405 N 10th St Unit 840
- 405 N 11th St
- 310 N 10th St
- 318 N 10th St
- 409 N 10th St Unit 840
- 219 N 10th St