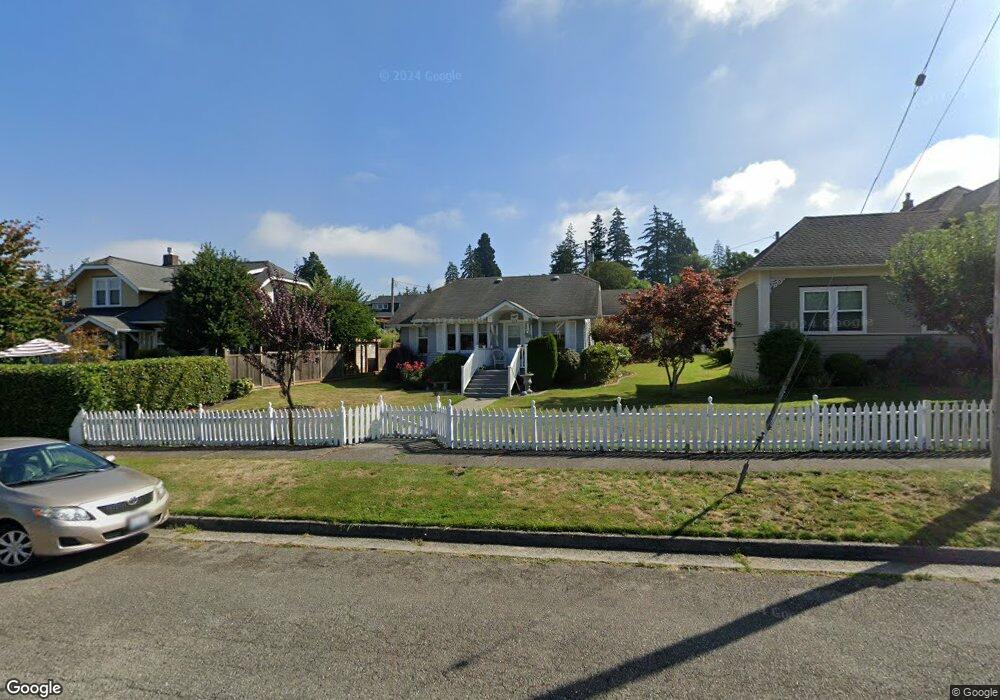
308 N 7th St Mount Vernon, WA 98273
Estimated Value: $428,000 - $458,000
3
Beds
1
Bath
904
Sq Ft
$487/Sq Ft
Est. Value
About This Home
This home is located at 308 N 7th St, Mount Vernon, WA 98273 and is currently estimated at $440,686, approximately $487 per square foot. 308 N 7th St is a home located in Skagit County with nearby schools including Lincoln Elementary School, La Venture Middle School, and Mount Vernon High School.
Ownership History
Date
Name
Owned For
Owner Type
Purchase Details
Closed on
Jul 28, 2008
Sold by
Storbakken Gelatt Judy
Bought by
Storbakken Gelatt Judy and Yrem Peggy Ann
Current Estimated Value
Purchase Details
Closed on
Jun 13, 2008
Sold by
Gelatt David Thomas
Bought by
Storbakken Gelatt Judy
Purchase Details
Closed on
May 30, 2008
Sold by
Vrem Peggy Ann
Bought by
Storbakken Gelatt Judy Ann and Gelatt David Thomas
Purchase Details
Closed on
Jul 18, 2006
Sold by
Storbakken Gelatt Judy Ann and Gelatt David Thomas
Bought by
Vrem Peggy Ann
Purchase Details
Closed on
Jun 6, 2006
Sold by
Vrem Peggy Ann
Bought by
Gelatt David Thomas and Storbakken Gelatt Judy Ann
Purchase Details
Closed on
Jun 2, 2006
Sold by
Storbakken Gelatt Judy Ann and Gelatt David Thomas
Bought by
Gelatt David Thomas and Storbakken Gelatt Judy Ann
Purchase Details
Closed on
May 25, 2006
Sold by
Vrem Peggy Ann
Bought by
Gelatt David Thomas and Storbakken Gelatt Judy Ann
Create a Home Valuation Report for This Property
The Home Valuation Report is an in-depth analysis detailing your home's value as well as a comparison with similar homes in the area
Home Values in the Area
Average Home Value in this Area
Purchase History
| Date | Buyer | Sale Price | Title Company |
|---|---|---|---|
| Storbakken Gelatt Judy | -- | Land Title Company | |
| Storbakken Gelatt Judy | -- | None Available | |
| Storbakken Gelatt Judy Ann | -- | None Available | |
| Vrem Peggy Ann | -- | None Available | |
| Gelatt David Thomas | -- | None Available | |
| Gelatt David Thomas | -- | None Available | |
| Gelatt David Thomas | $170,280 | None Available |
Source: Public Records
Tax History
| Year | Tax Paid | Tax Assessment Tax Assessment Total Assessment is a certain percentage of the fair market value that is determined by local assessors to be the total taxable value of land and additions on the property. | Land | Improvement |
|---|---|---|---|---|
| 2025 | $137 | $89,200 | -- | -- |
| 2024 | $138 | $89,200 | -- | -- |
| 2023 | $138 | $89,200 | $0 | $0 |
| 2022 | $160 | $89,200 | $0 | $0 |
| 2021 | $172 | $89,200 | $0 | $0 |
| 2020 | $178 | $89,200 | $0 | $0 |
| 2019 | $179 | $89,200 | $0 | $0 |
| 2018 | $185 | $89,200 | $0 | $0 |
| 2017 | $197 | $89,200 | $0 | $0 |
| 2016 | $206 | $166,200 | $73,200 | $93,000 |
| 2015 | $1,946 | $145,700 | $64,200 | $81,500 |
| 2013 | $223 | $89,200 | $0 | $0 |
Source: Public Records
Map
Nearby Homes
- 218 Evergreen St
- 1024 N 8th St
- 703 N 8th St
- 520 N 1st St
- 901 N 8th St
- 310 S 11th St Unit 212
- 310 S 11th St Unit 204
- 0 S 15th St
- 1211 N 8th St Unit 2
- 1211 N 8th St Unit 4
- 122 S Baker St
- 1200 N 12th Place
- 1103 S 6th St
- 303 S Baker St
- 0 N 18th St
- 319 E Section St
- 0 William Way
- 107 E Section St
- 1205 N 16th St
- 1209 S 10th St
Your Personal Tour Guide
Ask me questions while you tour the home.