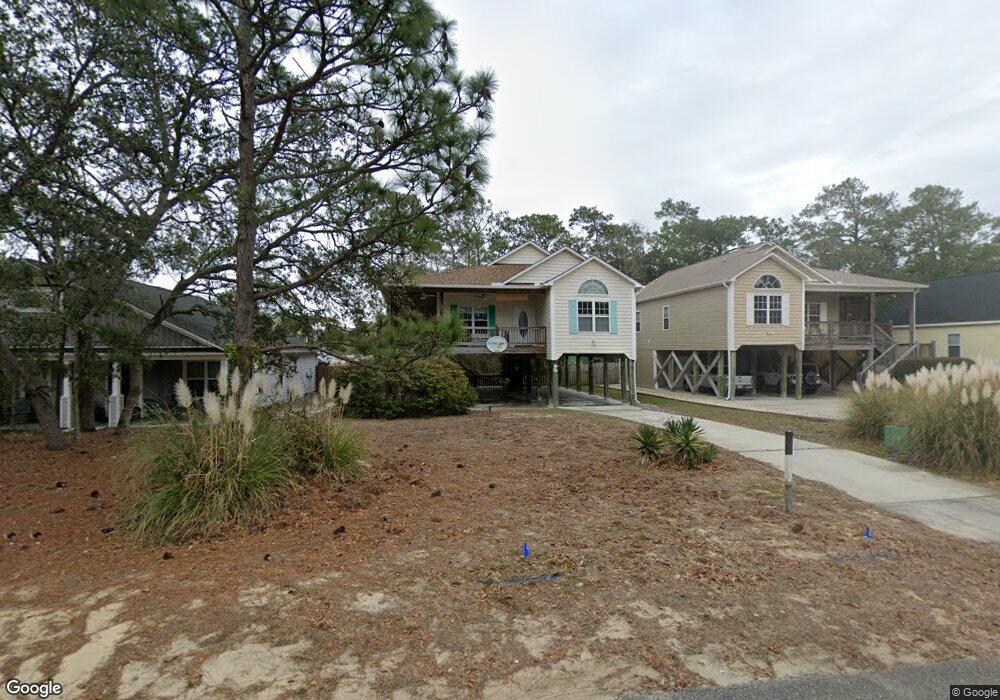
308 NE 46th St Oak Island, NC 28465
Estimated Value: $499,000 - $662,000
3
Beds
2
Baths
1,301
Sq Ft
$460/Sq Ft
Est. Value
About This Home
This home is located at 308 NE 46th St, Oak Island, NC 28465 and is currently estimated at $598,082, approximately $459 per square foot. 308 NE 46th St is a home located in Brunswick County with nearby schools including Southport Elementary School, South Brunswick Middle School, and South Brunswick High School.
Ownership History
Date
Name
Owned For
Owner Type
Purchase Details
Closed on
Aug 10, 2005
Sold by
Mccann Gordan A and Mccain Claire V
Bought by
Cotton Frank and Cotton Patricia
Current Estimated Value
Home Financials for this Owner
Home Financials are based on the most recent Mortgage that was taken out on this home.
Original Mortgage
$266,000
Outstanding Balance
$140,541
Interest Rate
5.75%
Mortgage Type
Adjustable Rate Mortgage/ARM
Estimated Equity
$457,541
Create a Home Valuation Report for This Property
The Home Valuation Report is an in-depth analysis detailing your home's value as well as a comparison with similar homes in the area
Home Values in the Area
Average Home Value in this Area
Purchase History
| Date | Buyer | Sale Price | Title Company |
|---|---|---|---|
| Cotton Frank | $400,000 | None Available |
Source: Public Records
Mortgage History
| Date | Status | Borrower | Loan Amount |
|---|---|---|---|
| Open | Cotton Frank | $266,000 |
Source: Public Records
Tax History Compared to Growth
Tax History
| Year | Tax Paid | Tax Assessment Tax Assessment Total Assessment is a certain percentage of the fair market value that is determined by local assessors to be the total taxable value of land and additions on the property. | Land | Improvement |
|---|---|---|---|---|
| 2025 | -- | $555,170 | $165,000 | $390,170 |
| 2024 | $2,321 | $555,170 | $165,000 | $390,170 |
| 2023 | $1,582 | $555,170 | $165,000 | $390,170 |
| 2022 | $1,582 | $267,000 | $63,000 | $204,000 |
| 2021 | $1,552 | $267,000 | $63,000 | $204,000 |
| 2020 | $1,527 | $267,000 | $63,000 | $204,000 |
| 2019 | $1,527 | $67,710 | $63,000 | $4,710 |
| 2018 | $1,300 | $45,560 | $40,000 | $5,560 |
| 2017 | $1,300 | $45,560 | $40,000 | $5,560 |
| 2016 | $1,275 | $45,560 | $40,000 | $5,560 |
| 2015 | $1,275 | $223,750 | $40,000 | $183,750 |
| 2014 | $1,065 | $199,911 | $45,000 | $154,911 |
Source: Public Records
Map
Nearby Homes