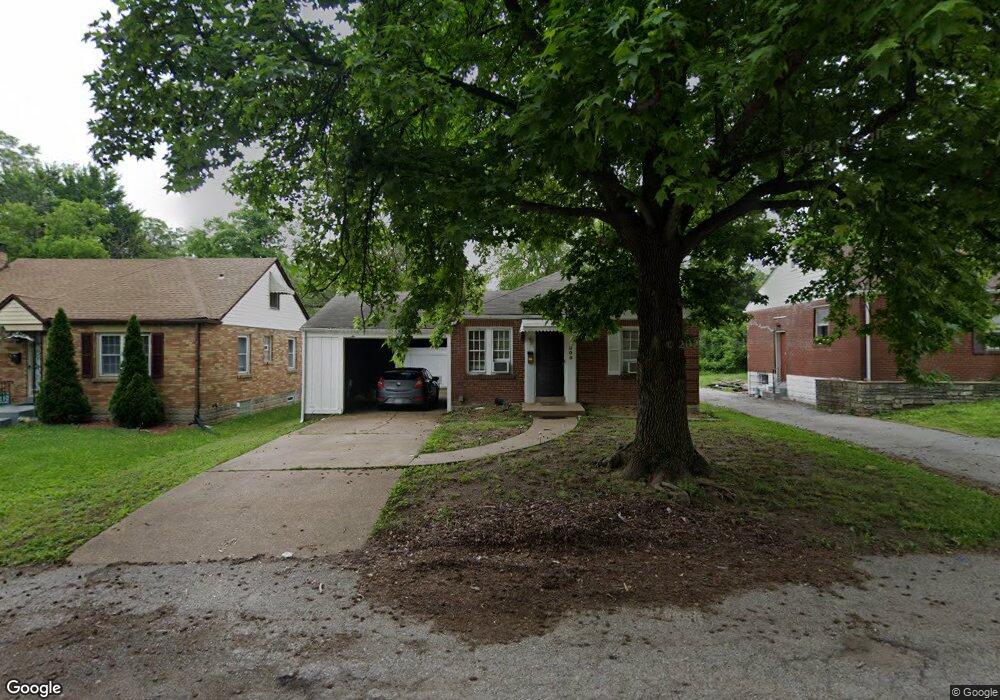
308 Newell Dr Saint Louis, MO 63135
Estimated Value: $77,000 - $100,000
2
Beds
2
Baths
875
Sq Ft
$100/Sq Ft
Est. Value
About This Home
This home is located at 308 Newell Dr, Saint Louis, MO 63135 and is currently estimated at $87,708, approximately $100 per square foot. 308 Newell Dr is a home located in St. Louis County with nearby schools including Ferguson Middle School, Johnson Wabash Elementary School, and McCluer High School.
Ownership History
Date
Name
Owned For
Owner Type
Purchase Details
Closed on
Apr 25, 2008
Sold by
Hsbc Bank Usa Na
Bought by
Midwest Home Investors Inc
Current Estimated Value
Home Financials for this Owner
Home Financials are based on the most recent Mortgage that was taken out on this home.
Original Mortgage
$40,000
Outstanding Balance
$25,166
Interest Rate
5.84%
Mortgage Type
Purchase Money Mortgage
Estimated Equity
$62,542
Purchase Details
Closed on
Aug 23, 2007
Sold by
Ware Samuel
Bought by
Hsbc Bank Usa Na and Sg Mortgage Securities Trust 2006-Fre1
Purchase Details
Closed on
Dec 9, 2005
Sold by
Fihh
Bought by
Ware Samuel and Ware Jacqueline
Home Financials for this Owner
Home Financials are based on the most recent Mortgage that was taken out on this home.
Original Mortgage
$63,750
Interest Rate
10.1%
Mortgage Type
Fannie Mae Freddie Mac
Purchase Details
Closed on
Apr 1, 2003
Sold by
Lane Valerie A
Bought by
Fihh
Purchase Details
Closed on
Oct 18, 2000
Sold by
Gullet Mark W and Gullet Juanita
Bought by
Lane Valerie A
Purchase Details
Closed on
Aug 17, 1998
Sold by
Jones Orzo T
Bought by
Gullet Mark W and Gullet Juanita L
Create a Home Valuation Report for This Property
The Home Valuation Report is an in-depth analysis detailing your home's value as well as a comparison with similar homes in the area
Home Values in the Area
Average Home Value in this Area
Purchase History
| Date | Buyer | Sale Price | Title Company |
|---|---|---|---|
| Midwest Home Investors Inc | $19,950 | None Available | |
| Hsbc Bank Usa Na | -- | None Available | |
| Ware Samuel | $75,000 | -- | |
| Fihh | -- | -- | |
| Lane Valerie A | -- | -- | |
| Gullet Mark W | $1,000 | -- |
Source: Public Records
Mortgage History
| Date | Status | Borrower | Loan Amount |
|---|---|---|---|
| Open | Midwest Home Investors Inc | $40,000 | |
| Previous Owner | Ware Samuel | $63,750 |
Source: Public Records
Tax History Compared to Growth
Tax History
| Year | Tax Paid | Tax Assessment Tax Assessment Total Assessment is a certain percentage of the fair market value that is determined by local assessors to be the total taxable value of land and additions on the property. | Land | Improvement |
|---|---|---|---|---|
| 2025 | $1,037 | $13,210 | $1,140 | $12,070 |
| 2024 | $1,037 | $14,160 | $1,540 | $12,620 |
| 2023 | $1,031 | $14,160 | $1,540 | $12,620 |
| 2022 | $768 | $9,100 | $1,140 | $7,960 |
| 2021 | $744 | $9,100 | $1,140 | $7,960 |
| 2020 | $854 | $9,440 | $1,160 | $8,280 |
| 2019 | $838 | $9,440 | $1,160 | $8,280 |
| 2018 | $734 | $7,340 | $1,160 | $6,180 |
| 2017 | $720 | $7,340 | $1,160 | $6,180 |
| 2016 | $945 | $9,580 | $1,540 | $8,040 |
| 2015 | $952 | $9,580 | $1,540 | $8,040 |
| 2014 | $1,298 | $13,030 | $930 | $12,100 |
Source: Public Records
Map
Nearby Homes
- 324 Newell Dr
- 213 Henquin Dr
- 8027 Aline Ave
- 8042 Patterson Dr
- 117 Henquin Dr
- 116 Henquin Dr
- 6130 Wulff Dr
- 218 N Marguerite Ave
- 810 Airport Rd
- 614 January Ave
- 138 N Marguerite Ave
- 6016 Shillington Dr
- 53 N Dade Ave
- 415 Warford Ave
- 439 Warford Ave
- 6005 Shillington Dr
- 8219 Davenport Dr
- 8140 Packard Ave
- 8306 Whitewater Dr
- 28 N Harvey Ave