Estimated Value: $250,000 - $268,001
3
Beds
3
Baths
1,768
Sq Ft
$146/Sq Ft
Est. Value
About This Home
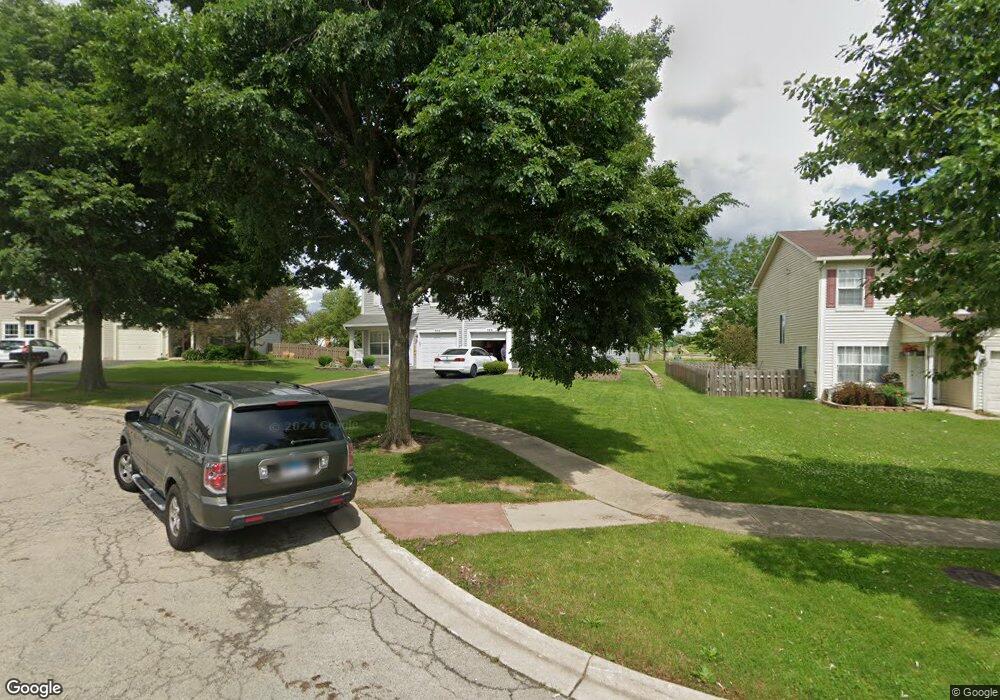
This home is located at 308 Paige St Unit 1, Plano, IL 60545 and is currently estimated at $258,000, approximately $145 per square foot. 308 Paige St Unit 1 is a home located in Kendall County with nearby schools including P.H. Miller Elementary School, Emily G. Johns School, and Centennial Elementary School.
Ownership History
Date
Name
Owned For
Owner Type
Purchase Details
Closed on
Jul 10, 2008
Sold by
Illinois Housing Development Authority
Bought by
Arellano Esteban and Arellano Maria K
Current Estimated Value
Home Financials for this Owner
Home Financials are based on the most recent Mortgage that was taken out on this home.
Original Mortgage
$131,950
Outstanding Balance
$85,469
Interest Rate
6.15%
Mortgage Type
FHA
Estimated Equity
$172,531
Purchase Details
Closed on
Jan 25, 2008
Sold by
Grimes Vincent T
Bought by
Illinois Housing Development Authority
Purchase Details
Closed on
Dec 14, 2004
Sold by
Lakewood Springs Llc
Bought by
Grimes Vincent T
Home Financials for this Owner
Home Financials are based on the most recent Mortgage that was taken out on this home.
Original Mortgage
$139,100
Interest Rate
5.82%
Mortgage Type
Purchase Money Mortgage
Create a Home Valuation Report for This Property
The Home Valuation Report is an in-depth analysis detailing your home's value as well as a comparison with similar homes in the area
Home Values in the Area
Average Home Value in this Area
Purchase History
| Date | Buyer | Sale Price | Title Company |
|---|---|---|---|
| Arellano Esteban | -- | Wheatland Title Guaranty | |
| Illinois Housing Development Authority | -- | None Available | |
| Grimes Vincent T | $143,500 | Chicago Title Insurance Co |
Source: Public Records
Mortgage History
| Date | Status | Borrower | Loan Amount |
|---|---|---|---|
| Open | Arellano Esteban | $131,950 | |
| Previous Owner | Grimes Vincent T | $139,100 |
Source: Public Records
Tax History Compared to Growth
Tax History
| Year | Tax Paid | Tax Assessment Tax Assessment Total Assessment is a certain percentage of the fair market value that is determined by local assessors to be the total taxable value of land and additions on the property. | Land | Improvement |
|---|---|---|---|---|
| 2024 | $6,336 | $69,262 | $6,262 | $63,000 |
| 2023 | $5,801 | $61,605 | $5,570 | $56,035 |
| 2022 | $5,801 | $56,209 | $5,082 | $51,127 |
| 2021 | $5,493 | $52,734 | $4,768 | $47,966 |
| 2020 | $5,495 | $51,701 | $4,675 | $47,026 |
| 2019 | $5,420 | $50,139 | $4,483 | $45,656 |
| 2018 | $5,052 | $44,907 | $4,270 | $40,637 |
| 2017 | $4,910 | $40,566 | $4,270 | $36,296 |
| 2016 | $4,550 | $34,517 | $4,270 | $30,247 |
| 2015 | $3,953 | $26,767 | $3,500 | $23,267 |
| 2014 | -- | $23,910 | $3,500 | $20,410 |
| 2013 | -- | $23,910 | $5,751 | $18,159 |
Source: Public Records
Map
Nearby Homes
- 3305 Paige St Unit 2A
- 3839 Munson St Unit 7054
- 3707 Munson St
- 3742 Pope Ct Unit 7403
- 3304 Alyssa St Unit 2A
- 3407 Tamaira St
- 4219 Cummins St
- 2813 Hoffman St
- 306 Waubonsee Dr
- 3928 Kristen Ct
- 331 Gregory Ln
- 114 Schmidt Ct
- 11948 Andrew St
- 4311 Cummins St
- 4310 Klatt St
- 3649 Bailey St
- 407 Keller St
- 416 Hubbard Cir
- 11921 Andrew St
- 3119 Hoffman St
- 308 Paige St Unit 2A
- 310 Paige St
- 310 Paige St Unit 1
- 306 Paige St
- 312 Paige St Unit 2A
- 312 Paige St Unit 312
- 304 Paige St Unit 2A
- 314 Paige St
- 316 Paige St
- 3311 Paige St
- 309 Paige St
- 3309 Paige St
- 311 Paige St Unit 2A
- 3304 Paige St
- 3307 Paige St Unit 2A
- 313 Paige St
- 315 Paige St
- 3302 Paige St Unit 2A
- 3303 Paige St
- 3323 Edward St