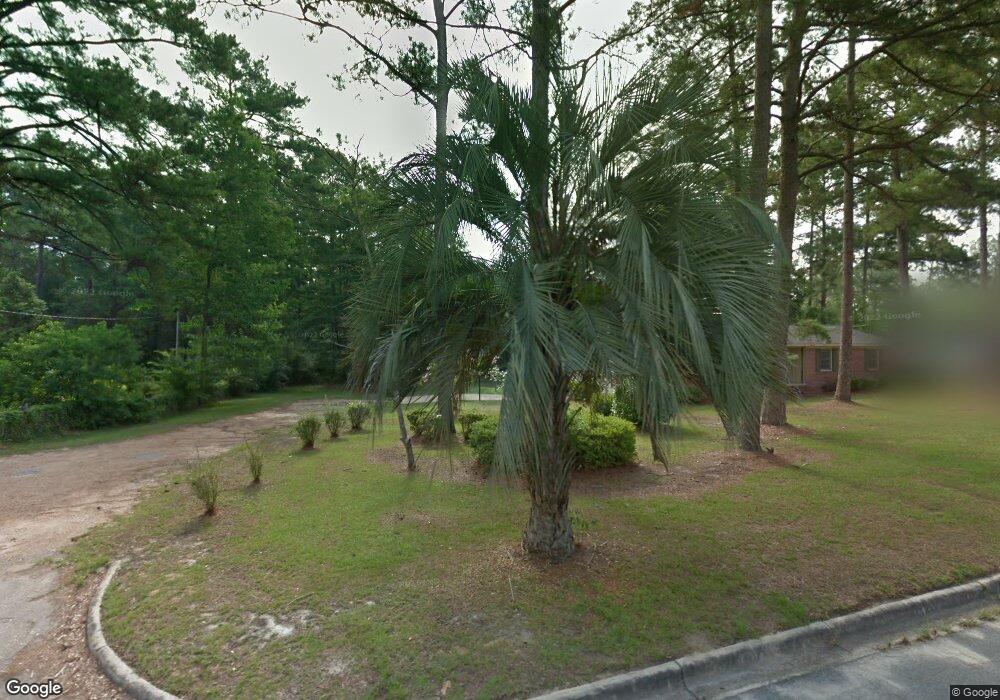
308 Palm Dr Thomasville, GA 31792
Estimated Value: $257,904 - $273,000
4
Beds
2
Baths
1,902
Sq Ft
$139/Sq Ft
Est. Value
About This Home
This home is located at 308 Palm Dr, Thomasville, GA 31792 and is currently estimated at $264,476, approximately $139 per square foot. 308 Palm Dr is a home located in Thomas County with nearby schools including Thomasville High School, Bishop Hall Charter School, and Rescue Mission Christian School.
Ownership History
Date
Name
Owned For
Owner Type
Purchase Details
Closed on
Nov 16, 2011
Sold by
Secretary Of Housing & Urban Development
Bought by
Davis Tiffany
Current Estimated Value
Home Financials for this Owner
Home Financials are based on the most recent Mortgage that was taken out on this home.
Original Mortgage
$105,564
Outstanding Balance
$72,504
Interest Rate
4.17%
Mortgage Type
FHA
Estimated Equity
$191,972
Purchase Details
Closed on
Nov 2, 2010
Sold by
Citimortgage Inc
Bought by
Secretary Dept Of Housing & Urban Develo
Purchase Details
Closed on
Jun 25, 2008
Sold by
Sampson Wesley F
Bought by
Horton Kirby
Home Financials for this Owner
Home Financials are based on the most recent Mortgage that was taken out on this home.
Original Mortgage
$176,240
Interest Rate
6.08%
Mortgage Type
FHA
Purchase Details
Closed on
May 12, 1993
Bought by
Sampson Wesley F
Create a Home Valuation Report for This Property
The Home Valuation Report is an in-depth analysis detailing your home's value as well as a comparison with similar homes in the area
Home Values in the Area
Average Home Value in this Area
Purchase History
| Date | Buyer | Sale Price | Title Company |
|---|---|---|---|
| Davis Tiffany | $108,310 | -- | |
| Secretary Dept Of Housing & Urban Develo | -- | -- | |
| Citimortgage Inc | $186,923 | -- | |
| Horton Kirby | $179,000 | -- | |
| Sampson Wesley F | $69,900 | -- |
Source: Public Records
Mortgage History
| Date | Status | Borrower | Loan Amount |
|---|---|---|---|
| Open | Davis Tiffany | $105,564 | |
| Previous Owner | Horton Kirby | $176,240 |
Source: Public Records
Tax History Compared to Growth
Tax History
| Year | Tax Paid | Tax Assessment Tax Assessment Total Assessment is a certain percentage of the fair market value that is determined by local assessors to be the total taxable value of land and additions on the property. | Land | Improvement |
|---|---|---|---|---|
| 2024 | $2,245 | $93,685 | $20,418 | $73,267 |
| 2023 | $2,182 | $88,749 | $20,418 | $68,331 |
| 2022 | $712 | $77,735 | $17,755 | $59,980 |
| 2021 | $687 | $68,387 | $17,755 | $50,632 |
| 2020 | $686 | $66,836 | $17,755 | $49,081 |
| 2019 | $693 | $66,836 | $17,755 | $49,081 |
| 2018 | $559 | $53,740 | $16,141 | $37,599 |
| 2017 | $555 | $52,287 | $14,365 | $37,922 |
| 2016 | $548 | $51,599 | $14,365 | $37,234 |
| 2015 | $567 | $52,769 | $13,397 | $39,372 |
| 2014 | $562 | $51,818 | $13,397 | $38,422 |
| 2013 | -- | $51,818 | $13,396 | $38,421 |
Source: Public Records
Map
Nearby Homes
- 1812 Whitehurst St
- 1601 E Pinetree Blvd
- 1523 E Pinetree Blvd
- 1917 Smith Ave
- 00 Williamsburg Ave
- US Highway 319 N
- 5.471ACR Hwy 19 S & 84 E
- 122 Covington Place
- 180 Crescent Cove
- 31 Crescent Cove
- 116 Huntington Pointe Dr
- 108 Huntington Pointe Dr
- 167 Timber Ridge Dr
- 171 Timber Ridge Dr
- 113 Huntington Pointe Dr
- 1709 Wimbledon Dr
- 204 Morningside Dr
- 1013 Remington Ave
- 105 Summercreek Ln
- 139 Summercreek Cove