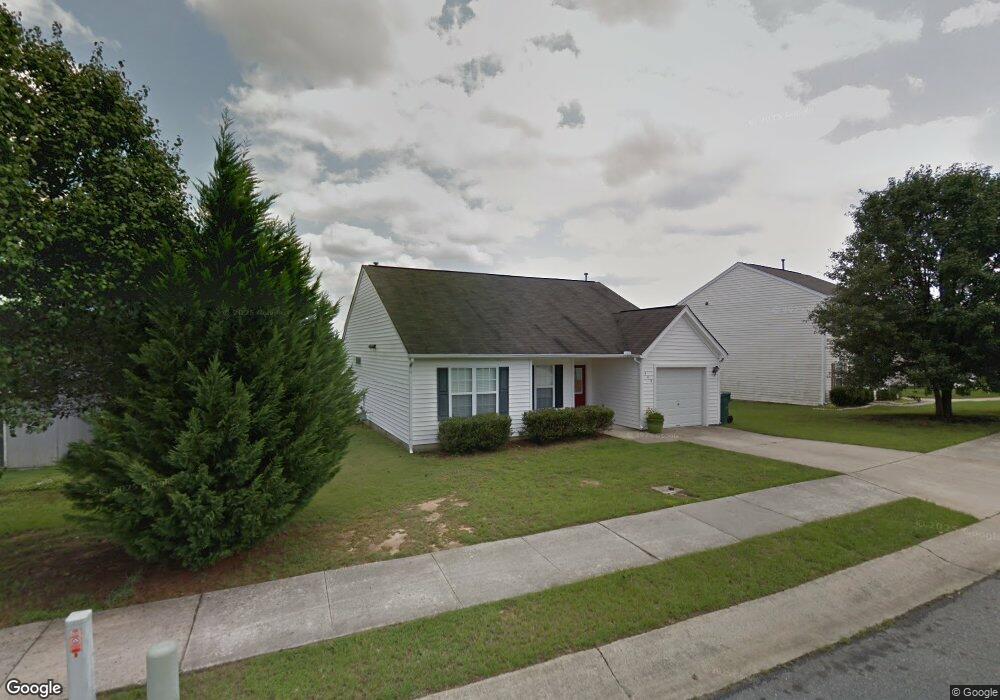
308 Pebble Way Durham, NC 27703
Eastern Durham NeighborhoodEstimated Value: $285,000 - $321,624
3
Beds
2
Baths
1,389
Sq Ft
$223/Sq Ft
Est. Value
About This Home
This home is located at 308 Pebble Way, Durham, NC 27703 and is currently estimated at $309,906, approximately $223 per square foot. 308 Pebble Way is a home located in Durham County with nearby schools including Glenn Elementary, John W Neal Middle School, and Southern School of Energy & Sustainability.
Ownership History
Date
Name
Owned For
Owner Type
Purchase Details
Closed on
Jul 18, 2007
Sold by
Jpmorgan Chase Bank
Bought by
Mcdonald Coral Ann and Mcdonald David
Current Estimated Value
Home Financials for this Owner
Home Financials are based on the most recent Mortgage that was taken out on this home.
Original Mortgage
$114,000
Outstanding Balance
$72,032
Interest Rate
6.71%
Mortgage Type
Purchase Money Mortgage
Estimated Equity
$237,874
Purchase Details
Closed on
Apr 19, 2007
Sold by
Sharp Derrick D and Sharp Toni R
Bought by
Jpmorgan Chase Bank
Purchase Details
Closed on
Mar 15, 2005
Sold by
Sharp Derrick D
Bought by
Brown Toni Rozelia
Purchase Details
Closed on
Nov 25, 1997
Sold by
Pulte Home Corp
Bought by
Sharp Derrick D and Sharp Toni R
Home Financials for this Owner
Home Financials are based on the most recent Mortgage that was taken out on this home.
Original Mortgage
$106,781
Interest Rate
7.35%
Mortgage Type
FHA
Create a Home Valuation Report for This Property
The Home Valuation Report is an in-depth analysis detailing your home's value as well as a comparison with similar homes in the area
Home Values in the Area
Average Home Value in this Area
Purchase History
| Date | Buyer | Sale Price | Title Company |
|---|---|---|---|
| Mcdonald Coral Ann | $120,000 | U S Land Title | |
| Jpmorgan Chase Bank | $117,831 | None Available | |
| Brown Toni Rozelia | -- | None Available | |
| Sharp Derrick D | $108,000 | -- |
Source: Public Records
Mortgage History
| Date | Status | Borrower | Loan Amount |
|---|---|---|---|
| Open | Mcdonald Coral Ann | $114,000 | |
| Previous Owner | Sharp Derrick D | $106,781 |
Source: Public Records
Tax History
| Year | Tax Paid | Tax Assessment Tax Assessment Total Assessment is a certain percentage of the fair market value that is determined by local assessors to be the total taxable value of land and additions on the property. | Land | Improvement |
|---|---|---|---|---|
| 2025 | $3,214 | $324,217 | $112,500 | $211,717 |
| 2024 | $2,265 | $162,388 | $31,200 | $131,188 |
| 2023 | $2,127 | $162,388 | $31,200 | $131,188 |
| 2022 | $2,078 | $162,388 | $31,200 | $131,188 |
| 2021 | $2,069 | $162,388 | $31,200 | $131,188 |
| 2020 | $2,020 | $162,388 | $31,200 | $131,188 |
| 2019 | $2,020 | $162,388 | $31,200 | $131,188 |
| 2018 | $1,785 | $131,576 | $24,960 | $106,616 |
| 2017 | $1,772 | $131,576 | $24,960 | $106,616 |
| 2016 | $1,712 | $131,576 | $24,960 | $106,616 |
| 2015 | $1,852 | $133,808 | $34,555 | $99,253 |
| 2014 | $1,852 | $133,808 | $34,555 | $99,253 |
Source: Public Records
Map
Nearby Homes
- 502 Quartz Dr
- 521 Quartz Dr
- 507 Lodestone Dr
- 3708 Thornwood Dr
- 3602 Thornwood Dr
- 412 Maymont Dr
- 3511 Thornwood Dr
- 10 Bentwood Place
- 608 Chalcedony Ct
- 403 Chadbourne Dr
- 912 Obsidian Way
- 709 Grandview Dr
- 3409 Judy Ave
- 1011 Homecoming Way
- 1113 Homecoming Way
- 4505 Tyne Dr
- 1113 Kindness Ln
- 914 Flanders Dr
- 210 Stoney Creek Cir
- 650 Ganyard Farm Way Unit 6
Your Personal Tour Guide
Ask me questions while you tour the home.