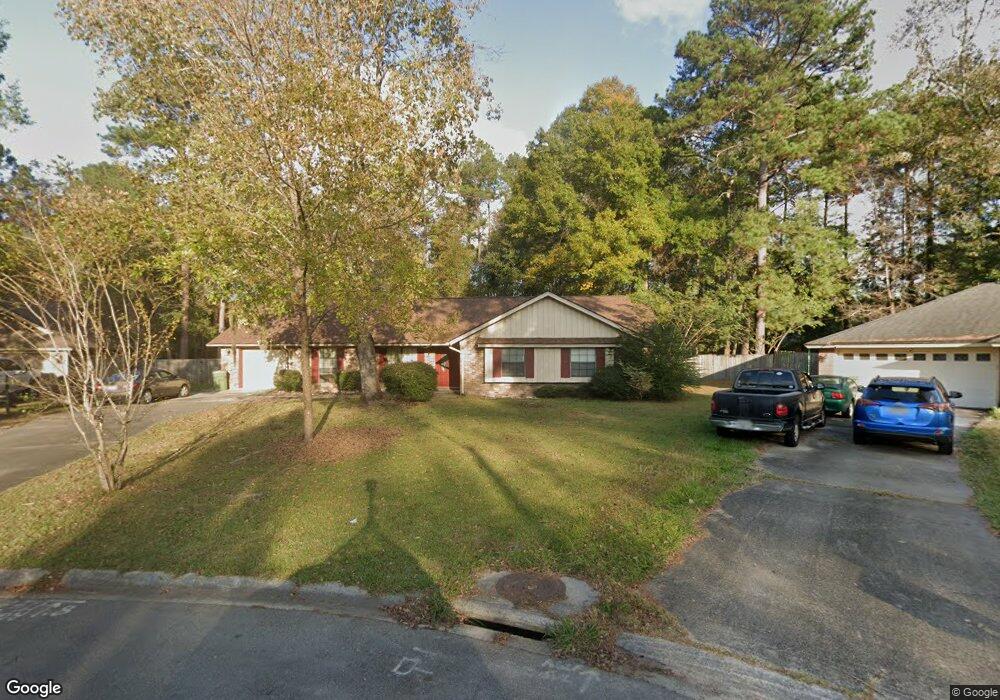
308 Quail Run Dr Hinesville, GA 31313
Estimated Value: $283,551 - $297,000
4
Beds
2
Baths
2,134
Sq Ft
$136/Sq Ft
Est. Value
About This Home
This home is located at 308 Quail Run Dr, Hinesville, GA 31313 and is currently estimated at $291,138, approximately $136 per square foot. 308 Quail Run Dr is a home located in Liberty County with nearby schools including Joseph Martin Elementary School, Midway Middle School, and Liberty County High School.
Ownership History
Date
Name
Owned For
Owner Type
Purchase Details
Closed on
Apr 1, 2025
Sold by
Emanuel Darnell
Bought by
Chestikova Mariia and Weber Christopher Leo
Current Estimated Value
Purchase Details
Closed on
Apr 1, 2024
Sold by
Centex Management Llc
Bought by
Emanuel Darnell and Emanuel Jody
Purchase Details
Closed on
Nov 30, 2020
Sold by
Emanuel Darnell C
Bought by
Centex Management Llc
Purchase Details
Closed on
May 15, 2007
Sold by
Lightfoot John R
Bought by
Emanuel Darnell
Home Financials for this Owner
Home Financials are based on the most recent Mortgage that was taken out on this home.
Original Mortgage
$145,600
Interest Rate
6.12%
Mortgage Type
New Conventional
Purchase Details
Closed on
Jul 27, 1994
Bought by
Lightfoot John R
Purchase Details
Closed on
May 28, 1993
Bought by
Burns Linda
Purchase Details
Closed on
Dec 1, 1992
Bought by
Secretary Of Va
Create a Home Valuation Report for This Property
The Home Valuation Report is an in-depth analysis detailing your home's value as well as a comparison with similar homes in the area
Home Values in the Area
Average Home Value in this Area
Purchase History
| Date | Buyer | Sale Price | Title Company |
|---|---|---|---|
| Chestikova Mariia | $288,000 | -- | |
| Emanuel Darnell | -- | -- | |
| Centex Management Llc | -- | -- | |
| Emanuel Darnell | $182,000 | -- | |
| Lightfoot John R | $117,300 | -- | |
| Burns Linda | $112,000 | -- | |
| Secretary Of Va | -- | -- | |
| Real Est Financing | $91,000 | -- |
Source: Public Records
Mortgage History
| Date | Status | Borrower | Loan Amount |
|---|---|---|---|
| Previous Owner | Emanuel Darnell | $145,600 | |
| Previous Owner | Emanuel Darnell | $36,400 |
Source: Public Records
Tax History Compared to Growth
Tax History
| Year | Tax Paid | Tax Assessment Tax Assessment Total Assessment is a certain percentage of the fair market value that is determined by local assessors to be the total taxable value of land and additions on the property. | Land | Improvement |
|---|---|---|---|---|
| 2024 | $5,699 | $116,277 | $15,200 | $101,077 |
| 2023 | $5,699 | $103,137 | $15,200 | $87,937 |
| 2022 | $3,487 | $75,003 | $15,200 | $59,803 |
| 2021 | $3,271 | $69,063 | $15,200 | $53,863 |
| 2020 | $3,079 | $64,381 | $15,200 | $49,181 |
| 2019 | $3,089 | $65,069 | $15,200 | $49,869 |
| 2018 | $3,073 | $65,090 | $15,200 | $49,890 |
| 2017 | $2,166 | $65,783 | $15,200 | $50,583 |
| 2016 | $2,959 | $65,802 | $15,200 | $50,602 |
| 2015 | $3,177 | $69,903 | $15,200 | $54,703 |
| 2014 | $3,177 | $69,903 | $15,200 | $54,703 |
| 2013 | -- | $69,902 | $15,200 | $54,702 |
Source: Public Records
Map
Nearby Homes
- 306 Quail Run Dr
- 307 Quail Run Dr
- 606 Thornwood Way
- 608 Thornwood Way
- 304 Quail Run Dr
- 604 Thornwood Way
- 305 Quail Run Dr
- 303 Quail Run Dr
- 603 Palmetto Trace
- 301 Quail Run Dr
- 605 Palmetto Trace
- 302 Quail Run Dr
- 602 Thornwood Way Unit 8
- 602 Thornwood Way
- 601 #30 Tupelo Trail
- 601 Palmetto Trace
- 610 Thornwood Way
- 602 Sandy Run Dr Unit 1
- 602 Sandy Run Dr
- 600 Palmetto Trace Unit 1