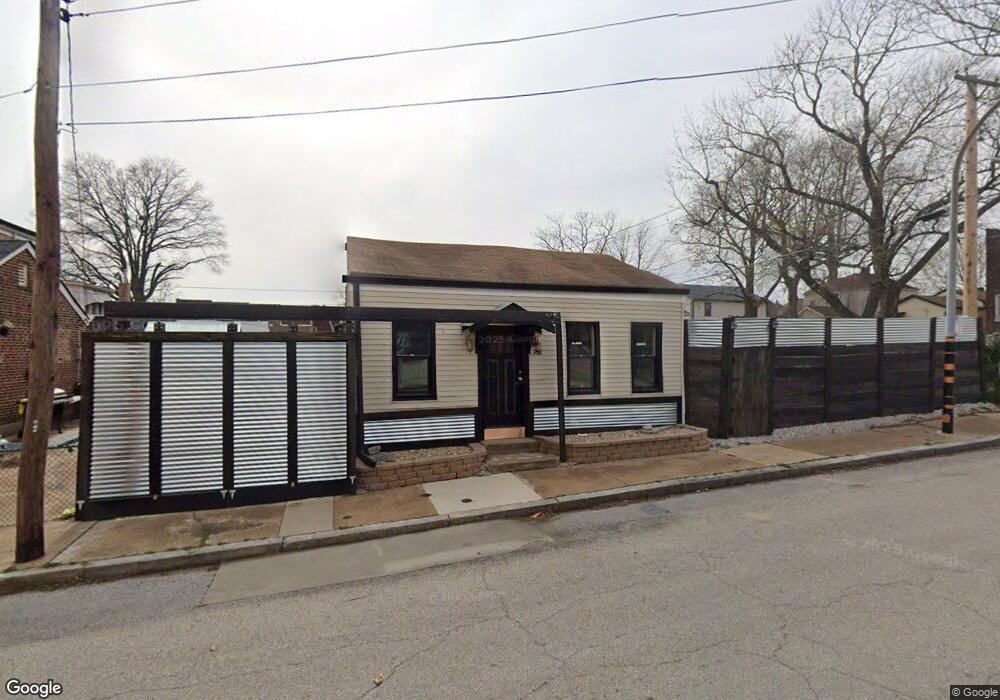
308 Quincy St Saint Louis, MO 63111
Carondelet NeighborhoodEstimated Value: $65,312 - $138,000
1
Bed
1
Bath
602
Sq Ft
$179/Sq Ft
Est. Value
About This Home
This home is located at 308 Quincy St, Saint Louis, MO 63111 and is currently estimated at $107,828, approximately $179 per square foot. 308 Quincy St is a home located in St. Louis City with nearby schools including Lyon at Blow Elementary School, Woodward Elementary School, and Roosevelt High School.
Ownership History
Date
Name
Owned For
Owner Type
Purchase Details
Closed on
Sep 29, 2023
Sold by
Dennis M Flores M and Dennis Darlene S
Bought by
Roesch Aaron
Current Estimated Value
Purchase Details
Closed on
Jul 18, 2006
Sold by
Land Reutilization Authority Of The City
Bought by
M C F Inc
Purchase Details
Closed on
Jun 5, 2006
Sold by
Flores Dennis M and Flores Darlene S
Bought by
Flores Dennis M and Flores Darlene S
Purchase Details
Closed on
Mar 21, 2000
Sold by
Flores Darlene and Flores Dennis
Bought by
Flores Dennis and Flores Darlene
Home Financials for this Owner
Home Financials are based on the most recent Mortgage that was taken out on this home.
Original Mortgage
$25,200
Interest Rate
8.33%
Purchase Details
Closed on
Feb 25, 2000
Sold by
Flores Properties Inc
Bought by
Flores Darlene
Home Financials for this Owner
Home Financials are based on the most recent Mortgage that was taken out on this home.
Original Mortgage
$25,200
Interest Rate
8.33%
Purchase Details
Closed on
Mar 23, 1999
Sold by
Mcf Inc
Bought by
Flores Properties Inc
Create a Home Valuation Report for This Property
The Home Valuation Report is an in-depth analysis detailing your home's value as well as a comparison with similar homes in the area
Home Values in the Area
Average Home Value in this Area
Purchase History
| Date | Buyer | Sale Price | Title Company |
|---|---|---|---|
| Roesch Aaron | -- | Title Partners | |
| M C F Inc | -- | None Available | |
| Flores Dennis M | -- | None Available | |
| Flores Dennis | -- | -- | |
| Flores Darlene | -- | -- | |
| Flores Properties Inc | -- | -- |
Source: Public Records
Mortgage History
| Date | Status | Borrower | Loan Amount |
|---|---|---|---|
| Previous Owner | Flores Dennis | $25,200 |
Source: Public Records
Tax History Compared to Growth
Tax History
| Year | Tax Paid | Tax Assessment Tax Assessment Total Assessment is a certain percentage of the fair market value that is determined by local assessors to be the total taxable value of land and additions on the property. | Land | Improvement |
|---|---|---|---|---|
| 2025 | $284 | $6,410 | $250 | $6,160 |
| 2024 | $272 | $3,060 | $250 | $2,810 |
| 2023 | $272 | $3,060 | $250 | $2,810 |
| 2022 | $258 | $2,780 | $250 | $2,530 |
| 2021 | $257 | $2,780 | $250 | $2,530 |
| 2020 | $246 | $2,660 | $250 | $2,410 |
| 2019 | $245 | $2,660 | $250 | $2,410 |
| 2018 | $229 | $2,400 | $250 | $2,150 |
| 2017 | $226 | $2,390 | $250 | $2,150 |
| 2016 | $228 | $2,390 | $250 | $2,150 |
| 2015 | $209 | $2,400 | $250 | $2,150 |
| 2014 | $214 | $2,400 | $250 | $2,150 |
| 2013 | -- | $2,450 | $250 | $2,200 |
Source: Public Records
Map
Nearby Homes
- 6924 Minnesota Ave
- 7027 Michigan Ave
- 6901 Pennsylvania Ave
- 6906 Pennsylvania Ave
- 7101 Virginia Ave
- 6822 Virginia Ave
- 7118 Vermont Ave
- 7227 Pennsylvania Ave
- 7220 Pennsylvania Ave
- 7226 Virginia Ave
- 7301 Pennsylvania Ave
- 6803 Virginia Ave
- 7310 Minnesota Ave
- 6707 Minnesota Ave Unit 6707 & 6709
- 7326 Pennsylvania Ave
- 7113 Alabama Ave
- 7343 Virginia Ave
- 6733 Alabama Ave
- 617 Haven St
- 7413 S Broadway
- 7007R Minnesota Ave
- 7009 Minnesota Ave
- 7007 Minnesota Ave
- 7007 Minnesota Ave Unit R
- 7011 Minnesota Ave
- 7001 Minnesota Ave
- 309 Quincy St
- 7000 Michigan Ave
- 7000 Michigan Ave
- 7013 Minnesota Ave
- 7006 Michigan Ave
- 6923 Minnesota Ave
- 6928 Michigan Ave
- 7002 Michigan Ave
- 7010 Michigan Ave
- 6926 Michigan Ave
- 7014 Michigan Ave
- 6920 Michigan Ave
- 6919 Minnesota Ave
- 7004 Minnesota Ave