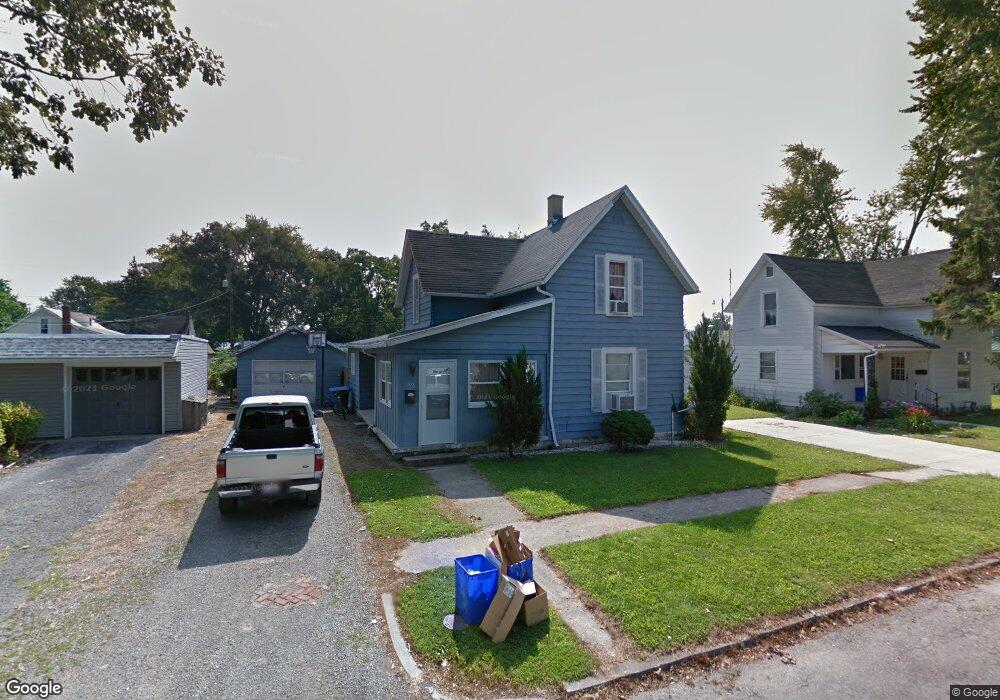
308 S Chestnut St van Wert, OH 45891
Estimated Value: $92,000 - $138,000
3
Beds
1
Bath
1,304
Sq Ft
$87/Sq Ft
Est. Value
About This Home
This home is located at 308 S Chestnut St, van Wert, OH 45891 and is currently estimated at $113,895, approximately $87 per square foot. 308 S Chestnut St is a home located in Van Wert County with nearby schools including Van Wert Early Childhood Center, Van Wert High School, and Lifelinks Community School.
Ownership History
Date
Name
Owned For
Owner Type
Purchase Details
Closed on
Dec 28, 2023
Sold by
Barbara A Welch Living Trust
Bought by
Baw46 Llc
Current Estimated Value
Purchase Details
Closed on
Nov 27, 2011
Bought by
Jp Morgan Bank Trustee
Purchase Details
Closed on
Oct 18, 2011
Sold by
Fannie Mae
Bought by
Welch Roger L
Purchase Details
Closed on
Jul 14, 2011
Sold by
Cross Steven
Bought by
Fannie Mae
Purchase Details
Closed on
Jul 14, 2006
Sold by
Darnell Shari
Bought by
Jpmorgan Chase Bank
Purchase Details
Closed on
Jan 8, 2001
Bought by
Darnell Steven and Darnell Shari J
Purchase Details
Closed on
Jan 5, 2001
Bought by
Cross Steven J
Purchase Details
Closed on
Aug 28, 1997
Bought by
Bragg Rex A and Bragg Debbie J
Purchase Details
Closed on
May 5, 1997
Bought by
Seekings Gene F
Purchase Details
Closed on
Feb 21, 1997
Bought by
Gamble Julie A
Purchase Details
Closed on
Jan 29, 1997
Bought by
Van Wert National Bank
Create a Home Valuation Report for This Property
The Home Valuation Report is an in-depth analysis detailing your home's value as well as a comparison with similar homes in the area
Home Values in the Area
Average Home Value in this Area
Purchase History
| Date | Buyer | Sale Price | Title Company |
|---|---|---|---|
| Baw46 Llc | -- | None Listed On Document | |
| Jp Morgan Bank Trustee | $48,000 | -- | |
| Welch Roger L | $19,000 | Attorney | |
| Fannie Mae | $16,000 | None Available | |
| Jpmorgan Chase Bank | $84,628 | None Available | |
| Darnell Steven | $50,000 | -- | |
| Darnell Steven | $50,000 | -- | |
| Cross Steven J | $25,000 | -- | |
| Cross Steven J | $25,000 | -- | |
| Bragg Rex A | $42,500 | -- | |
| Bragg Rex A | $42,500 | -- | |
| Seekings Gene F | $26,000 | -- | |
| Seekings Gene F | $26,000 | -- | |
| Gamble Julie A | $25,000 | -- | |
| Gamble Julie A | $25,000 | -- | |
| Van Wert National Bank | $23,000 | -- | |
| Van Wert National Bank | $23,000 | -- |
Source: Public Records
Tax History
| Year | Tax Paid | Tax Assessment Tax Assessment Total Assessment is a certain percentage of the fair market value that is determined by local assessors to be the total taxable value of land and additions on the property. | Land | Improvement |
|---|---|---|---|---|
| 2024 | $531 | $14,180 | $3,270 | $10,910 |
| 2023 | $523 | $14,180 | $3,270 | $10,910 |
| 2022 | $535 | $12,730 | $2,180 | $10,550 |
| 2021 | $522 | $12,730 | $2,180 | $10,550 |
| 2020 | $521 | $12,730 | $2,180 | $10,550 |
| 2019 | $454 | $10,770 | $2,180 | $8,590 |
| 2018 | $435 | $10,770 | $2,180 | $8,590 |
| 2017 | $449 | $10,770 | $2,180 | $8,590 |
| 2016 | $420 | $11,460 | $2,180 | $9,280 |
| 2015 | $421 | $11,460 | $2,180 | $9,280 |
| 2014 | $416 | $11,460 | $2,180 | $9,280 |
| 2013 | $448 | $11,460 | $2,180 | $9,280 |
Source: Public Records
Map
Nearby Homes
- 224 S Franklin St
- 300 S Wayne St
- 205 N Chestnut St
- 529 S Tyler St
- 142 E Raymond St
- 780 Maplewood Dr
- 631 S Washington St
- 000 Lincoln Hwy
- 14934 Lincoln Hwy
- 00 Lincoln Hwy
- 409 N Market St
- 138 E 2nd St
- 634 N Market St
- 326 Gordon Ave
- 114 S Wall St
- 515 N Jefferson St
- 692 N Market St
- 421 Boyd Ave
- 142 Gleason Ave
- 702 N Washington St
- 314 S Chestnut St
- 802 E Crawford St
- 814 E Crawford St
- 320 S Chestnut St
- 309 N Chestnut St
- 328 S Chestnut St
- 321 S Franklin St
- 309 S Chestnut St
- 313 S Chestnut St
- 226 S Chestnut St
- 303 S Franklin St
- 720 E Crawford St
- 315 S Franklin St
- 319 S Chestnut St
- 815 E Crawford St
- 327 S Franklin St
- 334 S Chestnut St
- 821 E Crawford St
- 220 S Chestnut St
- 329 S Chestnut St
Your Personal Tour Guide
Ask me questions while you tour the home.