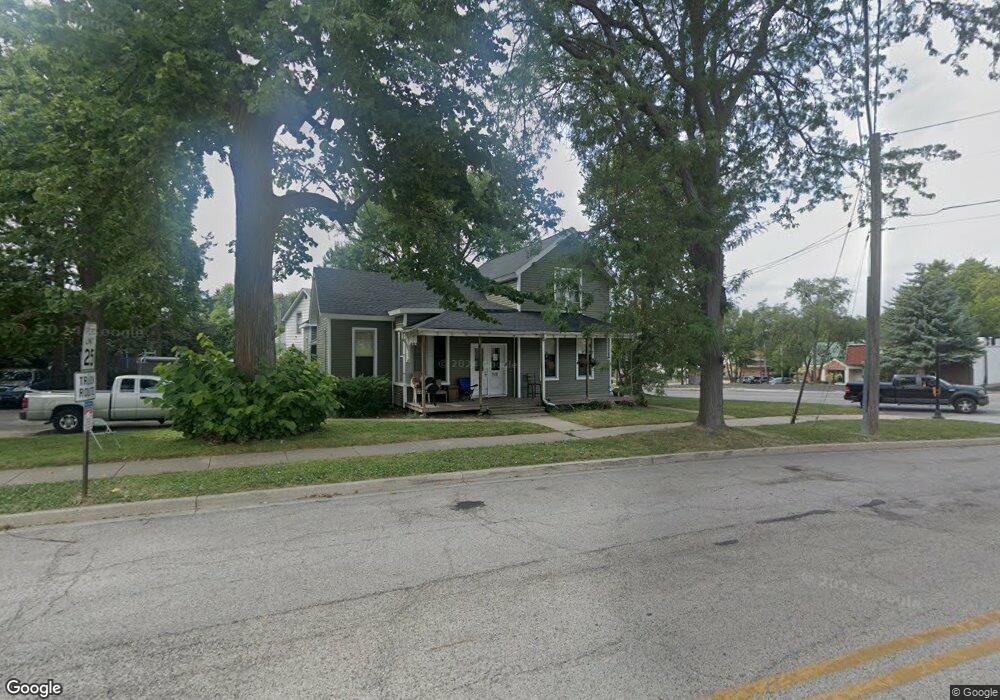
308 S Ml King jr Ave Waukegan, IL 60085
Downtown Waukegan NeighborhoodEstimated Value: $184,706 - $236,000
4
Beds
5
Baths
1,803
Sq Ft
$117/Sq Ft
Est. Value
About This Home
This home is located at 308 S Ml King jr Ave, Waukegan, IL 60085 and is currently estimated at $210,235, approximately $116 per square foot. 308 S Ml King jr Ave is a home located in Lake County with nearby schools including Carman-Buckner Elementary School, John R Lewis Middle School, and Waukegan High School.
Ownership History
Date
Name
Owned For
Owner Type
Purchase Details
Closed on
Dec 20, 2024
Sold by
Clear Capital Llc
Bought by
Clear Capital Core 1 Llc
Current Estimated Value
Home Financials for this Owner
Home Financials are based on the most recent Mortgage that was taken out on this home.
Original Mortgage
$200,000
Outstanding Balance
$198,424
Interest Rate
6.78%
Mortgage Type
Credit Line Revolving
Estimated Equity
$11,811
Purchase Details
Closed on
Jan 23, 2024
Sold by
Reinhardt Gary and Reinhardt Kathryn
Bought by
Clear Capital Llc
Purchase Details
Closed on
Aug 5, 2010
Sold by
Hughes Joseph A
Bought by
Reinhardt Gary and Reinhardt Kathryn
Create a Home Valuation Report for This Property
The Home Valuation Report is an in-depth analysis detailing your home's value as well as a comparison with similar homes in the area
Home Values in the Area
Average Home Value in this Area
Purchase History
| Date | Buyer | Sale Price | Title Company |
|---|---|---|---|
| Clear Capital Core 1 Llc | -- | None Listed On Document | |
| Clear Capital Llc | $150,000 | Chicago Title | |
| Reinhardt Gary | $75,000 | First American Title | |
| Reinhardt Gary | $45,000 | First American Title |
Source: Public Records
Mortgage History
| Date | Status | Borrower | Loan Amount |
|---|---|---|---|
| Open | Clear Capital Core 1 Llc | $200,000 |
Source: Public Records
Tax History Compared to Growth
Tax History
| Year | Tax Paid | Tax Assessment Tax Assessment Total Assessment is a certain percentage of the fair market value that is determined by local assessors to be the total taxable value of land and additions on the property. | Land | Improvement |
|---|---|---|---|---|
| 2024 | $4,922 | $57,975 | $13,341 | $44,634 |
| 2023 | $3,919 | $52,197 | $11,944 | $40,253 |
| 2022 | $3,919 | $40,090 | $9,725 | $30,365 |
| 2021 | $3,716 | $35,639 | $8,470 | $27,169 |
| 2020 | $3,513 | $30,991 | $7,902 | $23,089 |
| 2019 | $3,536 | $28,398 | $7,241 | $21,157 |
| 2018 | $2,254 | $17,432 | $5,380 | $12,052 |
| 2017 | $2,210 | $15,423 | $4,760 | $10,663 |
| 2016 | $2,959 | $19,145 | $5,908 | $13,237 |
| 2015 | $2,894 | $17,135 | $5,288 | $11,847 |
| 2014 | $4,082 | $24,127 | $4,847 | $19,280 |
| 2012 | $5,059 | $26,141 | $5,252 | $20,889 |
Source: Public Records
Map
Nearby Homes
- 502 Belvidere Rd
- 547 S Martin Luther King Junior Ave
- 215 S Park Ave
- 613 Clarke Ave
- 557 W Water St
- 305 Besley Place
- 408 Besley Place
- 613 Washington St
- 600 Sunderlin St
- 710 S Martin Luther King Junior Ave
- 515 May St
- 446 S Jackson St
- 222 Grand Ave
- 631 8th St
- 426 Julian St
- 842 Wadsworth Ave
- 815 Prescott St
- 306 Oak Crest St
- 924 Lenox Ave
- 1521 Catalpa Ave
- 319 Belvidere Rd
- 320 S Ml King jr Ave
- 401 Belvidere Rd
- 311 S Martin Luther King Junior Ave
- 324 S Ml King jr Ave
- 324 S Martin Luther King Junior Ave
- 317 S Martin Luther King Junior Ave
- 313 S Ml King jr Ave
- 315 S Ml King jr Ave
- 311 S Ml King jr Ave
- 315 S Martin Luther King jr Ave
- 227 Belvidere Rd
- 326 S Ml King jr Ave
- 326 S Martin Luther King Junior Ave
- 317 S Ml King jr Ave
- 321 S Ml King jr Ave
- 321 S Martin Luther King jr Ave
- 321 S Martin Luther King jr Ave
- 318 Belvidere Rd
- 404 Belvidere Rd