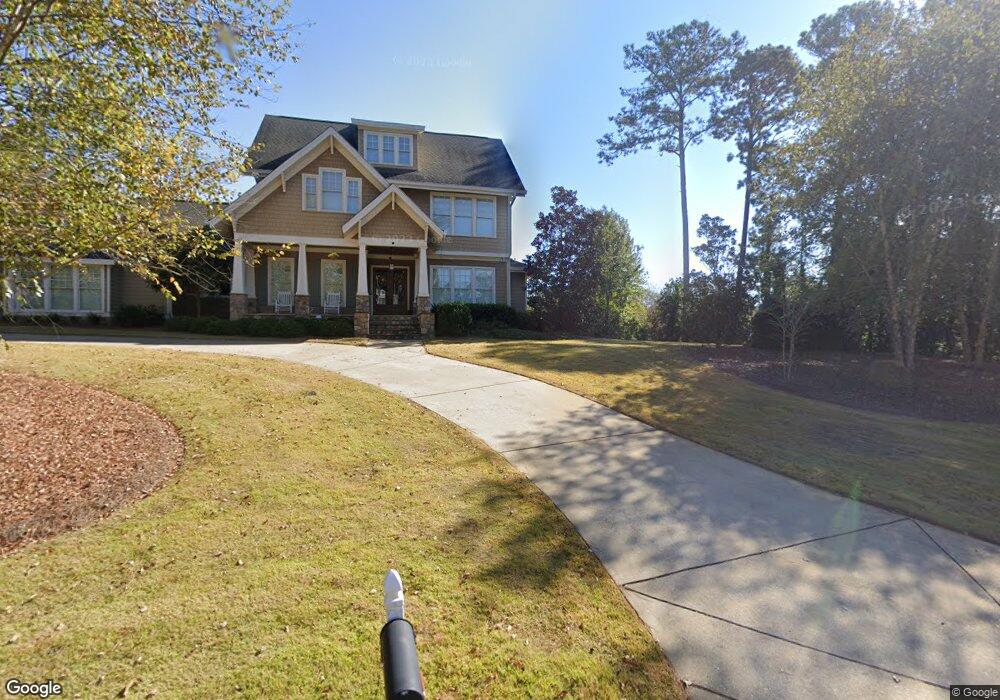
308 Saint Andrews Ct Lagrange, GA 30240
Estimated Value: $515,000 - $632,000
2
Beds
4
Baths
2,487
Sq Ft
$227/Sq Ft
Est. Value
About This Home
This home is located at 308 Saint Andrews Ct, Lagrange, GA 30240 and is currently estimated at $564,117, approximately $226 per square foot. 308 Saint Andrews Ct is a home located in Troup County with nearby schools including Hollis Hand Elementary School, Ethel W. Kight Elementary School, and Franklin Forest Elementary School.
Ownership History
Date
Name
Owned For
Owner Type
Purchase Details
Closed on
Oct 2, 2024
Sold by
Morgan James C
Bought by
Morgan Carol Aycock Tr and Morgan James Calvin Iii Tr
Current Estimated Value
Purchase Details
Closed on
Aug 9, 2023
Sold by
Foster Jane R
Bought by
Morgan James C
Purchase Details
Closed on
Sep 27, 2002
Bought by
Foster Jane R
Purchase Details
Closed on
Aug 12, 2002
Sold by
Dorothy Durand Seay
Purchase Details
Closed on
Aug 9, 2002
Sold by
John D Seay
Bought by
Dorothy Durand Seay
Purchase Details
Closed on
Jul 31, 2002
Sold by
Dorothy Seay
Bought by
John D Seay
Purchase Details
Closed on
Jul 14, 1995
Sold by
John D Seay
Bought by
Dorothy Seay
Purchase Details
Closed on
Aug 19, 1983
Sold by
Seay Seay and Seay Durand
Bought by
John D Seay
Purchase Details
Closed on
Nov 4, 1977
Sold by
Enloe Prop
Bought by
Seay Seay and Seay Durand
Purchase Details
Closed on
Oct 28, 1976
Sold by
Highland Country Club
Bought by
Enloe Prop
Create a Home Valuation Report for This Property
The Home Valuation Report is an in-depth analysis detailing your home's value as well as a comparison with similar homes in the area
Home Values in the Area
Average Home Value in this Area
Purchase History
| Date | Buyer | Sale Price | Title Company |
|---|---|---|---|
| Morgan Carol Aycock Tr | -- | -- | |
| Morgan James C | $480,000 | -- | |
| Foster Jane R | -- | -- | |
| -- | $349,500 | -- | |
| Dorothy Durand Seay | -- | -- | |
| John D Seay | -- | -- | |
| Dorothy Seay | -- | -- | |
| John D Seay | -- | -- | |
| Seay Seay | $18,000 | -- | |
| Enloe Prop | -- | -- |
Source: Public Records
Tax History Compared to Growth
Tax History
| Year | Tax Paid | Tax Assessment Tax Assessment Total Assessment is a certain percentage of the fair market value that is determined by local assessors to be the total taxable value of land and additions on the property. | Land | Improvement |
|---|---|---|---|---|
| 2024 | $5,509 | $214,400 | $50,000 | $164,400 |
| 2023 | $4,399 | $163,280 | $40,000 | $123,280 |
| 2022 | $4,389 | $159,240 | $40,000 | $119,240 |
| 2021 | $4,776 | $160,360 | $40,000 | $120,360 |
| 2020 | $4,776 | $160,360 | $40,000 | $120,360 |
| 2019 | $4,520 | $151,840 | $40,000 | $111,840 |
| 2018 | $4,359 | $146,520 | $40,000 | $106,520 |
| 2017 | $4,375 | $147,040 | $34,000 | $113,040 |
| 2016 | $4,273 | $143,649 | $34,000 | $109,649 |
| 2015 | $4,280 | $143,649 | $34,000 | $109,649 |
| 2014 | $4,219 | $141,388 | $34,000 | $107,388 |
| 2013 | -- | $140,020 | $34,000 | $106,020 |
Source: Public Records
Map
Nearby Homes
- 106 Highland Park
- 116 Deal Dr
- 101 Deal Dr
- 114 Millridge Dr
- 654 Cameron Mill Rd
- 203 S Chilton Crescent
- 603 Country Club Rd
- 201 S Chilton Crescent
- 748 Lakewood Dr
- 104 Sweetgum Dr
- 105 Ridgeview Dr
- 100 Creekside Dr Unit LOT 60A
- 106 S Chilton Crescent
- 724 Camellia Dr
- 107 Dixie Creek Dr
- 102 Ewing St
- 106 Ewing St
- 127 Ashling Dr
- 145 Turner St
- 705 Piney Woods Dr
- 310 Saint Andrews Ct
- 304 Saint Andrews Ct
- 200 Lakeshore Dr
- 312 Saint Andrews Ct
- 302 St Andrews
- 302 Saint Andrews Ct
- 202 Lakeshore Dr
- 314 Saint Andrews Ct
- 203 Lakeshore Dr
- 207 Lakeshore Dr
- 201 Lakeshore Dr
- 209 Lakeshore Dr
- 204 Lakeshore Dr
- 403 Highlander Run Unit 9
- 403 Highlander Run
- 211 Lakeshore Dr
- 205 Lakeshore Dr
- 206 Lakeshore Dr
- 405 Highlander Run Unit 10
- 405 Highlander Run