
Seller's Agent in 2022
Carrie Hutchinson
Re/Max Of Albany
(229) 344-4992
1 in this area
88 Total Sales
Estimated Value: $218,000 - $334,000
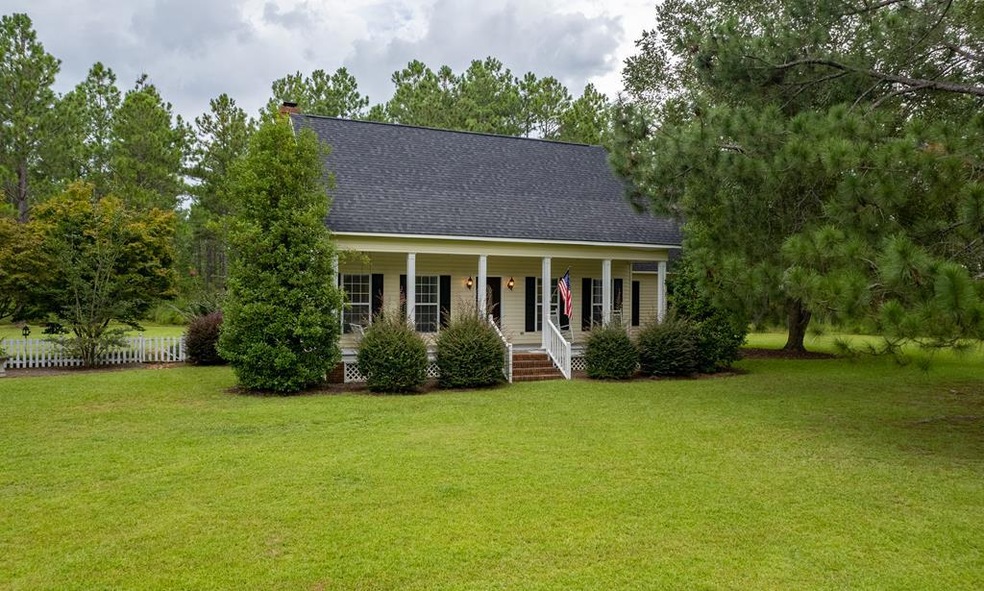
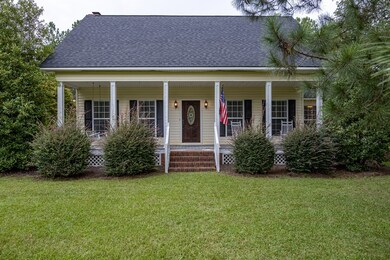
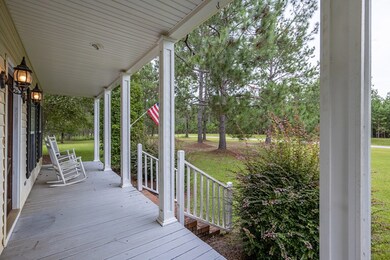
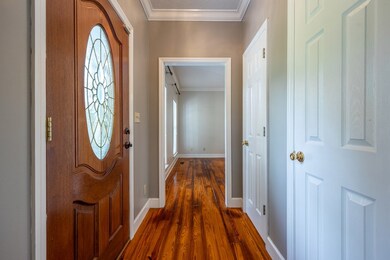
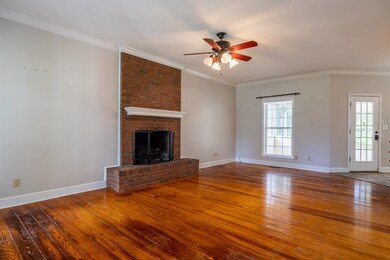
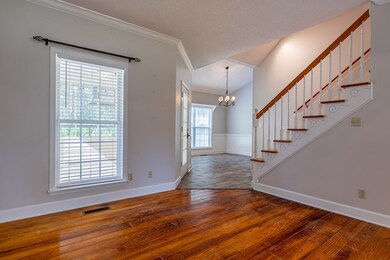
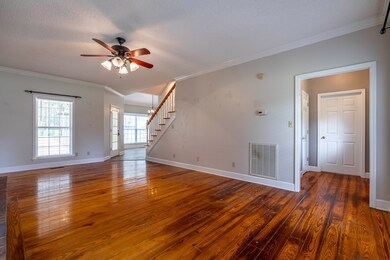
100% USDA FINANCING ELIGIBLE!* HEART PINE FLOORS * QUIET, COUNTRY LIVING only minutes from downtown Sylvester! Surrounded mostly by woods, this beautiful, custom built, one owner home has been well loved and is ready for the next chapter. With over 2000 square feet of living area, this 3 bedroom 2 bath home has plenty of space and loads of Southern charm. The main level features a formal living room with a gas fireplace, updated kitchen and dining area & the large laundry room with extra space for storage. There's also a HUGE den that features an office and separate entrance, making it perfect for a home based business! The primary bedroom has a very nice walk-in closet, full bathroom and a separate vanity/dressing area. Upstairs you'll find two additional bedrooms, a full bathroom and walk-in attic access. The outdoor space features a sprawling yard, a covered patio/outdoor kitchen and a wired workshop that is heated and cooled. Looking for a nice porch to enjoy the upcoming Fall weather? This one has TWO! Relax on the rocking chair front porch and the screened porch on the back of the house. Don't miss out on this beautiful home. Call a Realtor to schedule a private tour today!
Last Agent to Sell the Property
Re/Max Of Albany Brokerage Phone: 2294341600 License #387608 Listed on: 10/01/2022
Last Buyer's Agent
Non-Member Agent
Non Member Office
| Date | Buyer | Sale Price | Title Company |
|---|---|---|---|
| Wise Carlette M | -- | -- | |
| Anderson Jermaine | $265,000 | -- | |
| Helms James Kerry | -- | -- | |
| Helms James Kerry | -- | -- | |
| Helms James Kerry | $7,700 | -- |
| Date | Status | Borrower | Loan Amount |
|---|---|---|---|
| Previous Owner | Anderson Jermaine | $260,200 |
| Date | Event | Price | List to Sale | Price per Sq Ft |
|---|---|---|---|---|
| 11/22/2022 11/22/22 | Sold | $265,000 | -- | $122 / Sq Ft |
| 10/01/2022 10/01/22 | Pending | -- | -- | -- |
| Year | Tax Paid | Tax Assessment Tax Assessment Total Assessment is a certain percentage of the fair market value that is determined by local assessors to be the total taxable value of land and additions on the property. | Land | Improvement |
|---|---|---|---|---|
| 2024 | $2,168 | $58,688 | $3,068 | $55,620 |
| 2023 | $2,168 | $55,471 | $3,068 | $52,403 |
| 2022 | $1,939 | $55,471 | $3,068 | $52,403 |
| 2021 | $1,936 | $55,471 | $3,068 | $52,403 |
| 2020 | $1,939 | $55,471 | $3,068 | $52,403 |
| 2019 | $1,936 | $55,471 | $3,068 | $52,403 |
| 2018 | $1,881 | $55,471 | $3,068 | $52,403 |
| 2017 | $1,881 | $55,471 | $3,068 | $52,403 |
| 2016 | $1,936 | $55,471 | $3,068 | $52,403 |
| 2015 | $1,827 | $55,471 | $3,068 | $52,403 |
| 2014 | $1,827 | $55,471 | $3,068 | $52,403 |
| 2013 | -- | $55,471 | $3,068 | $52,403 |
| 2012 | -- | $55,471 | $3,068 | $52,403 |
Seller's Agent in 2022
Carrie Hutchinson
Re/Max Of Albany
(229) 344-4992
1 in this area
88 Total Sales
N
Buyer's Agent in 2022
Non-Member Agent
Non Member Office
Source: Albany Board of REALTORS®
MLS Number: 151021
APN: 00600-035-00E