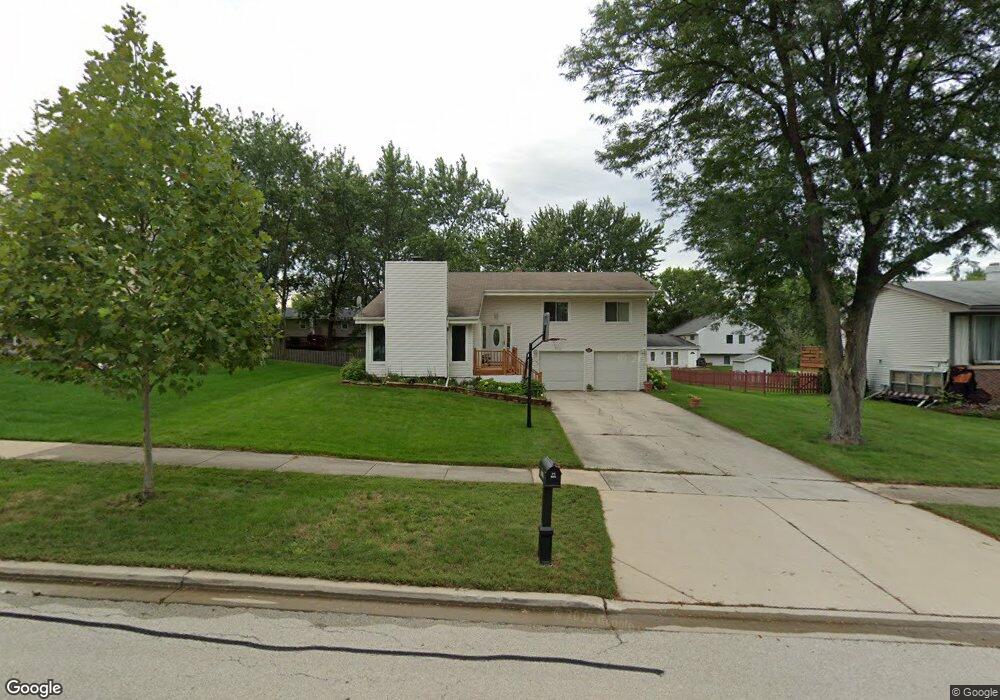
308 Surrey Ln Bloomingdale, IL 60108
Estimated Value: $373,000 - $439,000
4
Beds
2
Baths
2,025
Sq Ft
$205/Sq Ft
Est. Value
About This Home
This home is located at 308 Surrey Ln, Bloomingdale, IL 60108 and is currently estimated at $414,614, approximately $204 per square foot. 308 Surrey Ln is a home located in DuPage County with nearby schools including Marquardt Middle School and Glenbard East High School.
Ownership History
Date
Name
Owned For
Owner Type
Purchase Details
Closed on
Feb 21, 2001
Sold by
Torres Martin and Torres Maria
Bought by
Torres Martin and Torres Maria
Current Estimated Value
Purchase Details
Closed on
Jul 19, 1999
Sold by
Oszczapinski Stanislaw and Oszczapinski Maria
Bought by
Torres Martin L and Torres Maria S
Home Financials for this Owner
Home Financials are based on the most recent Mortgage that was taken out on this home.
Original Mortgage
$161,550
Outstanding Balance
$43,253
Interest Rate
7%
Estimated Equity
$371,361
Purchase Details
Closed on
Mar 12, 1999
Sold by
Villa Park Trust & Svgs Bank
Bought by
Oszczapinski Stanislaw and Oszczapinski Maria
Home Financials for this Owner
Home Financials are based on the most recent Mortgage that was taken out on this home.
Original Mortgage
$126,000
Interest Rate
6.85%
Create a Home Valuation Report for This Property
The Home Valuation Report is an in-depth analysis detailing your home's value as well as a comparison with similar homes in the area
Home Values in the Area
Average Home Value in this Area
Purchase History
| Date | Buyer | Sale Price | Title Company |
|---|---|---|---|
| Torres Martin | -- | -- | |
| Torres Martin L | $179,500 | Chicago Title Insurance Co | |
| Oszczapinski Stanislaw | $157,500 | -- |
Source: Public Records
Mortgage History
| Date | Status | Borrower | Loan Amount |
|---|---|---|---|
| Open | Torres Martin L | $161,550 | |
| Previous Owner | Oszczapinski Stanislaw | $126,000 |
Source: Public Records
Tax History Compared to Growth
Tax History
| Year | Tax Paid | Tax Assessment Tax Assessment Total Assessment is a certain percentage of the fair market value that is determined by local assessors to be the total taxable value of land and additions on the property. | Land | Improvement |
|---|---|---|---|---|
| 2024 | $9,976 | $119,137 | $34,806 | $84,331 |
| 2023 | $9,338 | $108,950 | $31,830 | $77,120 |
| 2022 | $8,707 | $95,780 | $31,620 | $64,160 |
| 2021 | $8,528 | $91,000 | $30,040 | $60,960 |
| 2020 | $8,056 | $88,780 | $29,310 | $59,470 |
| 2019 | $7,726 | $85,320 | $28,170 | $57,150 |
| 2018 | $8,094 | $83,330 | $27,430 | $55,900 |
| 2017 | $8,538 | $85,230 | $25,420 | $59,810 |
| 2016 | $8,105 | $78,880 | $23,530 | $55,350 |
| 2015 | $7,940 | $73,610 | $21,960 | $51,650 |
| 2014 | $7,912 | $72,730 | $21,700 | $51,030 |
| 2013 | $8,167 | $76,680 | $22,440 | $54,240 |
Source: Public Records
Map
Nearby Homes
- 2155 College Dr Unit 7
- 253 Sterling Ln
- 175 N Waters Edge Dr Unit 201
- 161 N Waters Edge Dr Unit 202
- 201 N Waters Edge Dr Unit 101
- 162 S Waters Edge Dr Unit 301
- 203 College Dr Unit C
- 186 Dunteman Dr Unit 301
- 2257 Lake Ridge Dr Unit 74
- 181 Lakeview Ct
- 224 Oakwood Ln
- 195 Duxbury Ct Unit D
- 120 Brewster Ct Unit D
- 135 Fairlane Ct Unit B
- 279 Blue Spruce Ln
- 133 Harding Ct
- 1943 Towner Ln
- 1941 Aspen Ln
- 158 S Prairie Ave
- 300 Starling Ct Unit A
- 310 Surrey Ln
- 306 Surrey Ln
- 305 Bridgewater Ln
- 307 Bridgewater Ln Unit 8
- 303 Bridgewater Ln
- 312 Surrey Ln
- 309 Surrey Ln
- 311 Surrey Ln
- 309 Bridgewater Ln
- 307 Surrey Ln
- 314 Surrey Ln
- 305 Surrey Ln
- 311 Bridgewater Ln
- 313 Surrey Ln
- 135 Surrey Dr
- 133 Surrey Dr
- 137 Surrey Dr
- 300 Bridgewater Ln
- 131 Surrey Dr
- 312 Plymouth Ln