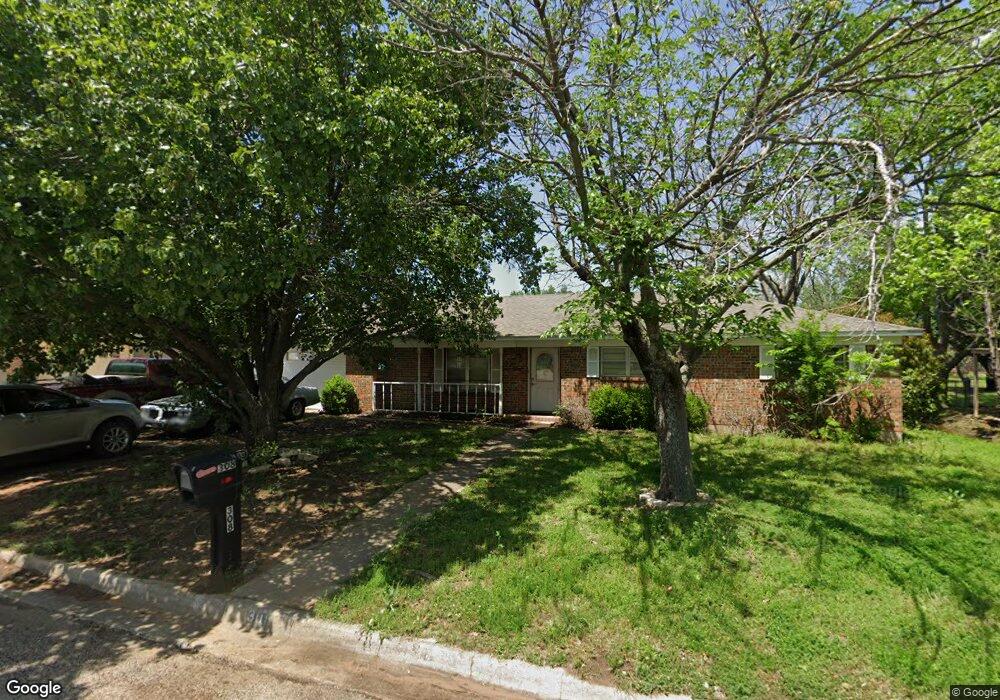
308 Texoma Dr Whitesboro, TX 76273
Estimated Value: $276,000 - $306,002
3
Beds
3
Baths
1,835
Sq Ft
$159/Sq Ft
Est. Value
About This Home
This home is located at 308 Texoma Dr, Whitesboro, TX 76273 and is currently estimated at $291,001, approximately $158 per square foot. 308 Texoma Dr is a home located in Grayson County with nearby schools including J.W. Hayes Primary School, Whitesboro Intermediate School, and Whitesboro Middle School.
Ownership History
Date
Name
Owned For
Owner Type
Purchase Details
Closed on
Dec 18, 2019
Sold by
The Charis Team Llc
Bought by
Loftice Peggy
Current Estimated Value
Purchase Details
Closed on
Jun 15, 2016
Sold by
Wood Don S and Wood Cynthia
Bought by
Huffman Mark and Huffman Sandra
Home Financials for this Owner
Home Financials are based on the most recent Mortgage that was taken out on this home.
Original Mortgage
$60,000
Interest Rate
3.57%
Mortgage Type
New Conventional
Purchase Details
Closed on
Jul 6, 2012
Sold by
Double Diamond Inc
Bought by
Wood Don S and Wood Cynthia A
Purchase Details
Closed on
Mar 31, 2012
Sold by
Double Diamond Inc
Bought by
Wood Don S and Wood Cyntha A
Purchase Details
Closed on
Jan 29, 2012
Sold by
Double Diamond Inc
Bought by
Wood Don S and Wood Cynthia A
Purchase Details
Closed on
Jan 29, 2011
Sold by
Double Diamond Inc
Bought by
Wood Don S and Wood Cynthia A
Create a Home Valuation Report for This Property
The Home Valuation Report is an in-depth analysis detailing your home's value as well as a comparison with similar homes in the area
Home Values in the Area
Average Home Value in this Area
Purchase History
| Date | Buyer | Sale Price | Title Company |
|---|---|---|---|
| Loftice Peggy | -- | None Available | |
| Huffman Mark | -- | None Available | |
| Wood Don S | $59,591 | None Available | |
| Wood Don S | -- | None Available | |
| Wood Don S | -- | None Available | |
| Wood Don S | -- | None Available | |
| Wood Don S | -- | None Available |
Source: Public Records
Mortgage History
| Date | Status | Borrower | Loan Amount |
|---|---|---|---|
| Previous Owner | Huffman Mark | $60,000 | |
| Closed | Wood Don S | $0 |
Source: Public Records
Tax History Compared to Growth
Tax History
| Year | Tax Paid | Tax Assessment Tax Assessment Total Assessment is a certain percentage of the fair market value that is determined by local assessors to be the total taxable value of land and additions on the property. | Land | Improvement |
|---|---|---|---|---|
| 2025 | $3,337 | $170,685 | $46,125 | $124,560 |
| 2024 | $3,337 | $169,394 | $45,000 | $124,394 |
| 2023 | $4,677 | $259,477 | $44,100 | $215,377 |
| 2022 | $4,446 | $225,580 | $47,925 | $177,655 |
| 2021 | $3,932 | $183,385 | $31,275 | $152,110 |
| 2020 | $4,047 | $181,234 | $28,013 | $153,221 |
| 2019 | $2,850 | $121,385 | $15,620 | $105,765 |
| 2018 | $2,903 | $121,385 | $15,620 | $105,765 |
| 2017 | $2,673 | $110,463 | $12,263 | $98,200 |
| 2016 | $2,662 | $110,000 | $7,425 | $102,575 |
| 2015 | $2,705 | $110,311 | $7,425 | $102,886 |
| 2014 | $2,368 | $109,464 | $7,425 | $102,039 |
Source: Public Records
Map
Nearby Homes
- 313 Texoma Dr
- 203 Red River Dr
- 216 Red River Rd
- 707 N Union St
- 53 ac U S Highway 82
- US U S Highway 82
- 508 N Jordan St
- 115 D St
- 605 Abney St
- 701 Park Place
- 706 Abney St
- 873 Anderson Rd
- 205 Anderson Rd
- 309 Elm St
- TBD Center Park Dr
- 103 Tipton St
- 406 N Union St
- 230 Center St
- 114 Byrom Ct
- 400 Wild Wood Ln
- 310 Texoma Dr
- 306 Texoma Dr
- 309 Red River Dr
- 311 Red River Dr
- 307 Red River Dr
- 312 Texoma Dr
- 309 Texoma Dr
- 304 Texoma Dr
- 311 Texoma Dr
- 307 Texoma Dr
- 313 Red River Dr
- 305 Red River Dr
- 305 Texoma Dr
- 314 Texoma Dr
- 302 Texoma Dr
- 303 Red River Dr
- 308 Red River Dr
- 315 Texoma Dr
- 303 Texoma Dr
- 310 Red River Dr