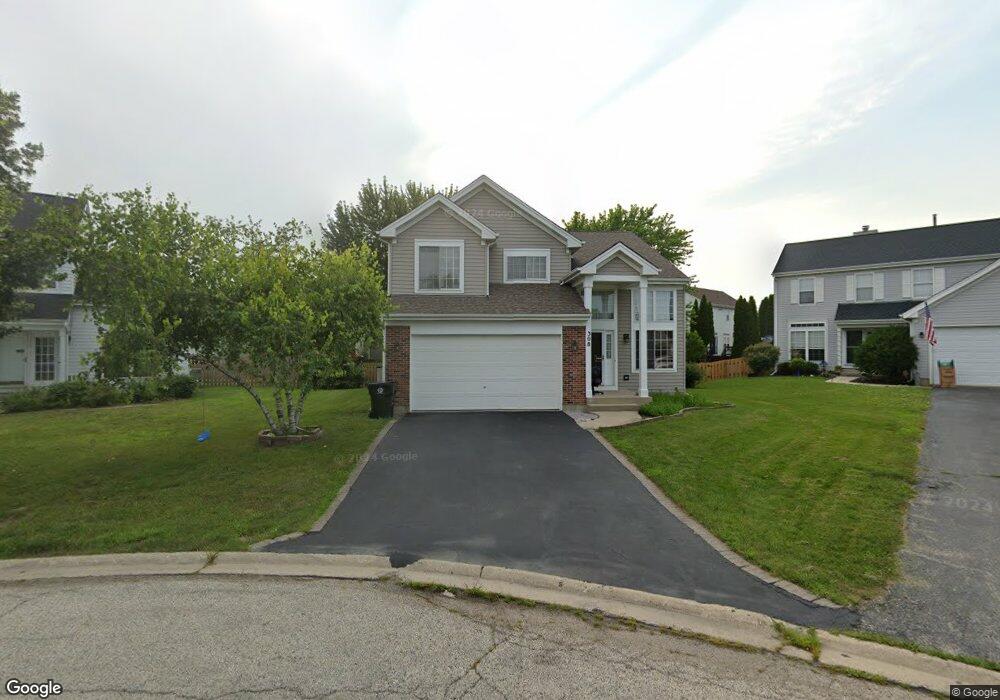
308 W Applegate Ct Round Lake, IL 60073
Estimated Value: $303,000 - $352,000
3
Beds
3
Baths
1,713
Sq Ft
$196/Sq Ft
Est. Value
About This Home
This home is located at 308 W Applegate Ct, Round Lake, IL 60073 and is currently estimated at $335,186, approximately $195 per square foot. 308 W Applegate Ct is a home located in Lake County with nearby schools including Village Elementary School, John T. Magee Middle School, and Round Lake High School.
Ownership History
Date
Name
Owned For
Owner Type
Purchase Details
Closed on
Jan 25, 2001
Sold by
Hight Sheila
Bought by
To Ty and Kou Connie L
Current Estimated Value
Home Financials for this Owner
Home Financials are based on the most recent Mortgage that was taken out on this home.
Original Mortgage
$119,000
Interest Rate
7.22%
Purchase Details
Closed on
Nov 10, 1999
Sold by
Nieves Donnie and Nieves Roslyn D
Bought by
Hight Ralph D and Hight Sheila
Home Financials for this Owner
Home Financials are based on the most recent Mortgage that was taken out on this home.
Original Mortgage
$100,000
Interest Rate
7.88%
Purchase Details
Closed on
Sep 20, 1996
Sold by
Kimball Hill Inc
Bought by
Nieves Donnie and Nieves Roslyn B
Home Financials for this Owner
Home Financials are based on the most recent Mortgage that was taken out on this home.
Original Mortgage
$159,500
Interest Rate
7.93%
Mortgage Type
VA
Create a Home Valuation Report for This Property
The Home Valuation Report is an in-depth analysis detailing your home's value as well as a comparison with similar homes in the area
Home Values in the Area
Average Home Value in this Area
Purchase History
| Date | Buyer | Sale Price | Title Company |
|---|---|---|---|
| To Ty | $174,000 | -- | |
| Hight Ralph D | $165,000 | First American Title | |
| Nieves Donnie | $160,000 | Chicago Title Insurance Co | |
| Nieves Donnie | $160,000 | Chicago Title Insurance Co |
Source: Public Records
Mortgage History
| Date | Status | Borrower | Loan Amount |
|---|---|---|---|
| Closed | To Ty | $119,000 | |
| Previous Owner | Hight Ralph D | $100,000 | |
| Previous Owner | Nieves Donnie | $159,500 |
Source: Public Records
Tax History
| Year | Tax Paid | Tax Assessment Tax Assessment Total Assessment is a certain percentage of the fair market value that is determined by local assessors to be the total taxable value of land and additions on the property. | Land | Improvement |
|---|---|---|---|---|
| 2024 | $7,868 | $92,327 | $16,846 | $75,481 |
| 2023 | $7,229 | $84,735 | $15,461 | $69,274 |
| 2022 | $7,229 | $75,098 | $11,247 | $63,851 |
| 2021 | $7,636 | $72,182 | $10,810 | $61,372 |
| 2020 | $7,312 | $68,679 | $10,285 | $58,394 |
| 2019 | $7,129 | $65,892 | $9,868 | $56,024 |
| 2018 | $7,549 | $61,754 | $13,315 | $48,439 |
| 2017 | $7,406 | $58,089 | $12,525 | $45,564 |
| 2016 | $7,123 | $53,622 | $11,562 | $42,060 |
| 2015 | $6,860 | $48,988 | $10,563 | $38,425 |
| 2014 | $6,738 | $49,454 | $9,470 | $39,984 |
| 2012 | $6,707 | $51,649 | $9,890 | $41,759 |
Source: Public Records
Map
Nearby Homes
- 249 W Whispering Oaks Ln Unit 295
- 241 W Whispering Oaks Ln Unit 29/1
- 341 W Treehouse Ln Unit 114
- 47 S Treehouse Ln Unit 83
- 308 Hackberry Cir
- 113 Orchard St
- 602 S Rosehall Ln
- 644 S Rosehall Ln Unit 644
- 97 W Essington Dr
- 752 S Parkside Dr Unit 4
- 314 Maple Ln
- 216 Brierhill Dr
- 116 Highmoor Dr
- 121 Highmoor Dr
- 325 Hillandale St
- 423 Windridge Dr
- 426 Alpine Dr
- 482 N Colony Dr
- 407 Greenwood Dr
- 328 Clifton Dr
- 305 W Applegate Ct
- 219 S Tanglewood Ct
- 300 W Applegate Ct
- 227 S Tanglewood Ct
- 213 S Tanglewood Ct
- 299 W Applegate Ct
- 322 W Weeping Willow Rd
- 290 W Applegate Ct
- 211 S Tanglewood Ct
- 184 S Basswood Ct
- 235 S Tanglewood Ct
- 186 S Basswood Ct
- 183 S Thistle Ct
- 316 W Weeping Willow Rd
- 190 S Basswood Ct
- 210 S Tanglewood Ct
- 187 S Thistle Ct
- 178 S Basswood Ct
- 282 W Holly Ct
- 271 W Blackthorn Ct