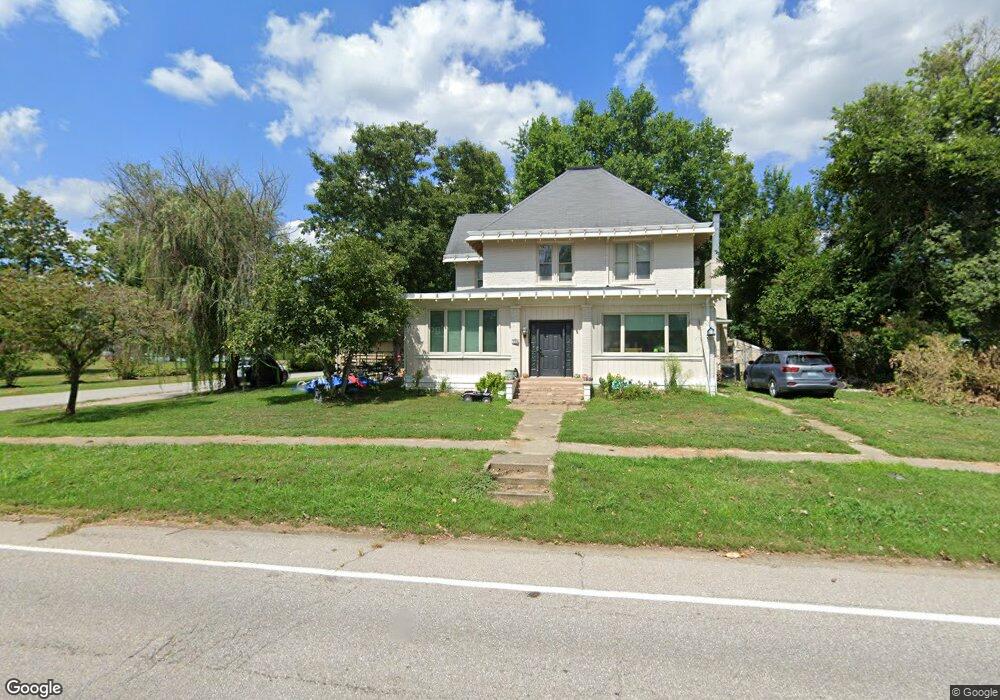
308 W Main St Warsaw, KY 41095
Estimated Value: $260,046 - $450,000
4
Beds
2
Baths
3,392
Sq Ft
$99/Sq Ft
Est. Value
About This Home
This home is located at 308 W Main St, Warsaw, KY 41095 and is currently estimated at $336,682, approximately $99 per square foot. 308 W Main St is a home located in Gallatin County with nearby schools including Gallatin County Lower Elementary School, Gallatin County Upper Elementary School, and Gallatin County Middle School.
Ownership History
Date
Name
Owned For
Owner Type
Purchase Details
Closed on
Feb 12, 2025
Sold by
Bruener Roger W
Bought by
Bruener Robin Lynn
Current Estimated Value
Purchase Details
Closed on
Jan 9, 2012
Sold by
Bruener Roger W
Bought by
Bruener Roger W and Bruener Robin Lynn
Home Financials for this Owner
Home Financials are based on the most recent Mortgage that was taken out on this home.
Original Mortgage
$75,000
Interest Rate
4.07%
Create a Home Valuation Report for This Property
The Home Valuation Report is an in-depth analysis detailing your home's value as well as a comparison with similar homes in the area
Home Values in the Area
Average Home Value in this Area
Purchase History
| Date | Buyer | Sale Price | Title Company |
|---|---|---|---|
| Bruener Robin Lynn | -- | None Listed On Document | |
| Bruener Robin Lynn | -- | None Listed On Document | |
| Bruener Roger W | $100,000 | -- |
Source: Public Records
Mortgage History
| Date | Status | Borrower | Loan Amount |
|---|---|---|---|
| Previous Owner | Bruener Roger W | $75,000 |
Source: Public Records
Tax History Compared to Growth
Tax History
| Year | Tax Paid | Tax Assessment Tax Assessment Total Assessment is a certain percentage of the fair market value that is determined by local assessors to be the total taxable value of land and additions on the property. | Land | Improvement |
|---|---|---|---|---|
| 2024 | $906 | $131,500 | $20,000 | $111,500 |
| 2023 | $913 | $131,500 | $20,000 | $111,500 |
| 2022 | $979 | $131,500 | $20,000 | $111,500 |
| 2021 | $986 | $131,500 | $20,000 | $111,500 |
| 2020 | $1,024 | $131,500 | $20,000 | $111,500 |
| 2019 | $850 | $115,400 | $20,000 | $95,400 |
| 2018 | $869 | $115,400 | $20,000 | $95,400 |
| 2017 | $869 | $115,400 | $20,000 | $95,400 |
| 2016 | -- | $100,000 | $30,000 | $70,000 |
| 2014 | $2,100 | $100,000 | $30,000 | $70,000 |
| 2011 | $2,100 | $189,000 | $30,000 | $159,000 |
Source: Public Records
Map
Nearby Homes