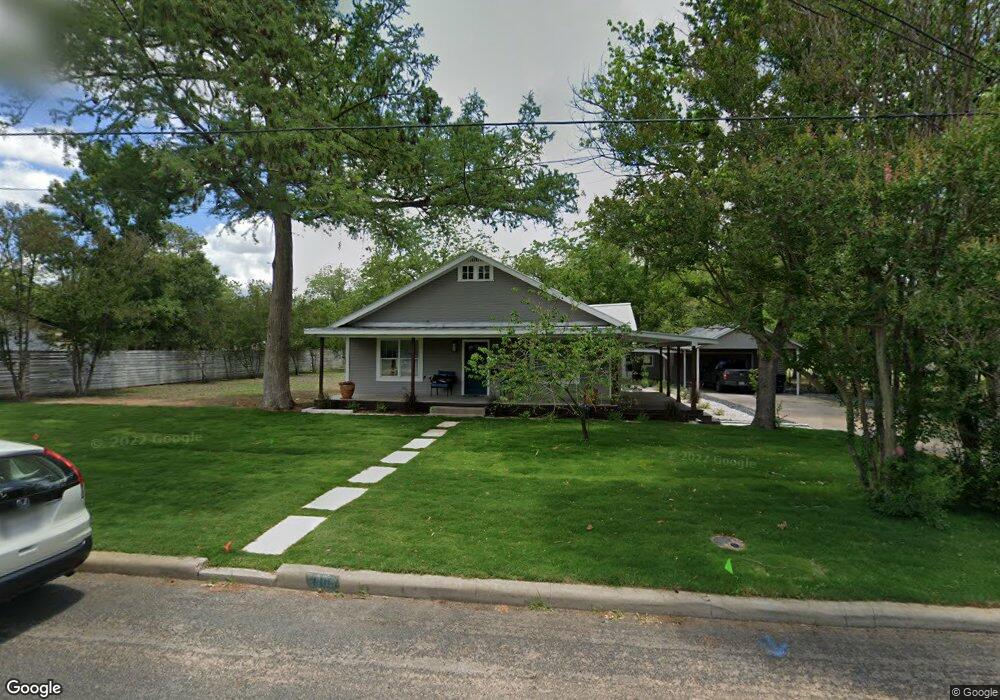
308 W Morse St Fredericksburg, TX 78624
Estimated Value: $726,000 - $877,000
3
Beds
2
Baths
2,120
Sq Ft
$381/Sq Ft
Est. Value
About This Home
This home is located at 308 W Morse St, Fredericksburg, TX 78624 and is currently estimated at $808,308, approximately $381 per square foot. 308 W Morse St is a home located in Gillespie County with nearby schools including Fredericksburg High School, Ambleside School of Fredericksburg, and St. Mary's Catholic School.
Ownership History
Date
Name
Owned For
Owner Type
Purchase Details
Closed on
Jun 28, 2010
Sold by
Miles Cheryl C and Miles Cary A
Bought by
Hammond Jeffrey B and Hammond Barclay L
Current Estimated Value
Home Financials for this Owner
Home Financials are based on the most recent Mortgage that was taken out on this home.
Original Mortgage
$270,000
Outstanding Balance
$180,064
Interest Rate
4.87%
Mortgage Type
New Conventional
Estimated Equity
$628,244
Create a Home Valuation Report for This Property
The Home Valuation Report is an in-depth analysis detailing your home's value as well as a comparison with similar homes in the area
Home Values in the Area
Average Home Value in this Area
Purchase History
| Date | Buyer | Sale Price | Title Company |
|---|---|---|---|
| Hammond Jeffrey B | -- | None Available |
Source: Public Records
Mortgage History
| Date | Status | Borrower | Loan Amount |
|---|---|---|---|
| Open | Hammond Jeffrey B | $270,000 |
Source: Public Records
Tax History Compared to Growth
Tax History
| Year | Tax Paid | Tax Assessment Tax Assessment Total Assessment is a certain percentage of the fair market value that is determined by local assessors to be the total taxable value of land and additions on the property. | Land | Improvement |
|---|---|---|---|---|
| 2025 | $8,434 | $673,725 | $364,550 | $322,540 |
| 2024 | $8,434 | $612,477 | $364,550 | $405,560 |
| 2023 | $6,821 | $556,797 | $364,550 | $424,150 |
| 2022 | $7,565 | $640,450 | $245,260 | $395,190 |
| 2021 | $7,762 | $506,430 | $145,970 | $360,460 |
| 2020 | $7,205 | $418,330 | $106,450 | $311,880 |
| 2019 | $6,851 | $418,330 | $106,450 | $311,880 |
| 2018 | $6,201 | $364,370 | $89,160 | $275,210 |
| 2017 | $5,794 | $344,970 | $89,160 | $255,810 |
| 2016 | $5,267 | $288,080 | $80,760 | $207,320 |
| 2015 | -- | $274,020 | $73,850 | $200,170 |
| 2014 | -- | $265,320 | $72,860 | $192,460 |
Source: Public Records
Map
Nearby Homes
- 313 W Hackberry St
- 211 W Hackberry St
- 318 W Hackberry St
- 904 N Orange St
- 707 N Milam St
- 337 W Hackberry St
- 808 N Crockett St
- 907 N Crockett St
- 1415 N Milam St Unit 3FR
- 333 W Burbank St
- 335 W Burbank St
- 206 W Burbank St
- 111 W Burbank St
- 209 W Mulberry St
- 108 W Centre St
- 327 W Mulberry St
- 103 W Centre St
- 805 N Edison St
- 113 Ellendale Place
- 102 Ellendale Place
- 306 W Morse St
- 312 W Morse St
- 806 N Orange St
- 804 N Orange St
- 802 N Orange St
- 307 W Hackberry St
- 309 W Hackberry St
- 709 N Orange St
- 311 W Hackberry St
- 316 W Morse St
- 301 W Hackberry St
- 221 W Morse St
- 710 N Orange St
- 212 W Morse St
- 219 W Morse St
- 707 N Orange St
- 317 W Hackberry St
- 807 N Orange St Unit 10BR
- 318 W Morse St
- 805 N Elm St