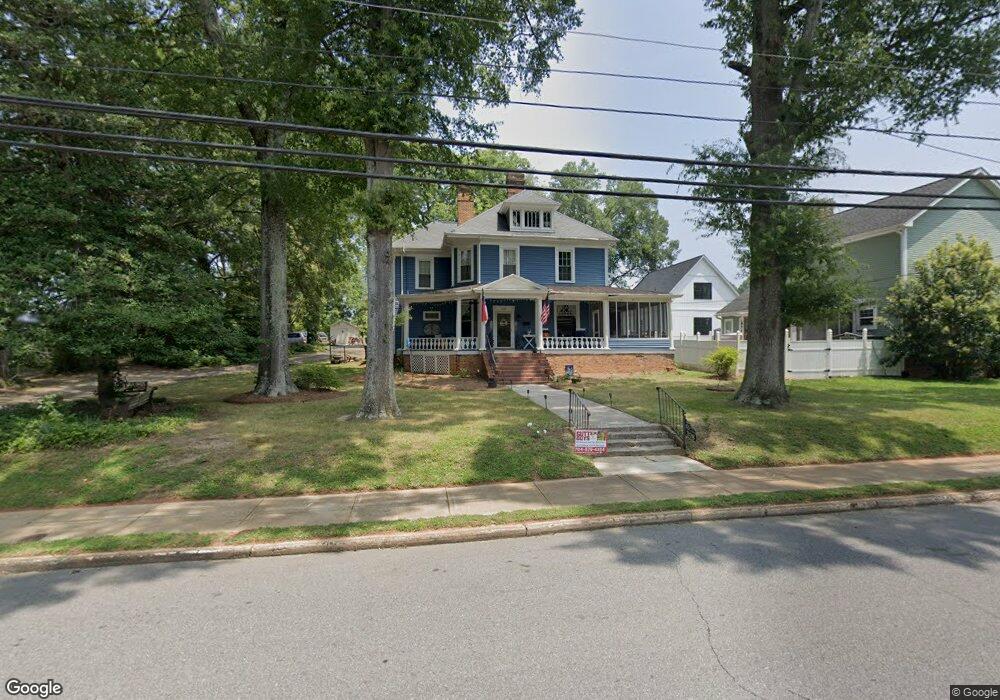
308 W Mountain St Unit 10 Kings Mountain, NC 28086
Estimated Value: $320,000 - $452,128
5
Beds
4
Baths
2,900
Sq Ft
$135/Sq Ft
Est. Value
About This Home
This home is located at 308 W Mountain St Unit 10, Kings Mountain, NC 28086 and is currently estimated at $390,532, approximately $134 per square foot. 308 W Mountain St Unit 10 is a home located in Cleveland County with nearby schools including West Elementary School, Kings Mountain Middle, and Kings Mountain Intermediate School.
Ownership History
Date
Name
Owned For
Owner Type
Purchase Details
Closed on
Jan 30, 2018
Sold by
Brucker Stanley E
Bought by
Dees Randy R
Current Estimated Value
Home Financials for this Owner
Home Financials are based on the most recent Mortgage that was taken out on this home.
Original Mortgage
$147,723
Outstanding Balance
$124,982
Interest Rate
3.95%
Mortgage Type
VA
Estimated Equity
$265,550
Purchase Details
Closed on
Jun 15, 2010
Sold by
Potter James T and Potter Sarah K
Bought by
Brucker Stanley E and Brucker Martha E Potter
Home Financials for this Owner
Home Financials are based on the most recent Mortgage that was taken out on this home.
Original Mortgage
$211,500
Interest Rate
3.75%
Mortgage Type
New Conventional
Create a Home Valuation Report for This Property
The Home Valuation Report is an in-depth analysis detailing your home's value as well as a comparison with similar homes in the area
Home Values in the Area
Average Home Value in this Area
Purchase History
| Date | Buyer | Sale Price | Title Company |
|---|---|---|---|
| Dees Randy R | $186,000 | None Available | |
| Brucker Stanley E | $235,000 | None Available |
Source: Public Records
Mortgage History
| Date | Status | Borrower | Loan Amount |
|---|---|---|---|
| Open | Dees Randy R | $147,723 | |
| Previous Owner | Brucker Stanley E | $211,500 |
Source: Public Records
Tax History Compared to Growth
Tax History
| Year | Tax Paid | Tax Assessment Tax Assessment Total Assessment is a certain percentage of the fair market value that is determined by local assessors to be the total taxable value of land and additions on the property. | Land | Improvement |
|---|---|---|---|---|
| 2025 | $4,304 | $419,928 | $72,036 | $347,892 |
| 2024 | $2,634 | $223,490 | $38,419 | $185,071 |
| 2023 | $2,621 | $223,490 | $38,419 | $185,071 |
| 2022 | $2,510 | $223,490 | $38,419 | $185,071 |
| 2021 | $2,468 | $218,571 | $38,419 | $180,152 |
| 2020 | $1,789 | $153,647 | $29,614 | $124,033 |
| 2019 | $1,789 | $153,647 | $29,614 | $124,033 |
| 2018 | $1,788 | $153,647 | $29,614 | $124,033 |
| 2017 | $1,558 | $134,345 | $29,614 | $104,731 |
| 2016 | $1,564 | $134,345 | $29,614 | $104,731 |
| 2015 | $1,744 | $154,029 | $29,614 | $124,415 |
| 2014 | $1,744 | $154,029 | $29,614 | $124,415 |
Source: Public Records
Map
Nearby Homes
- 106 N Tracy St
- 316 S Cansler St
- 400 S Cansler St
- 300 N Watterson St
- 200 E Gold St
- 411 S Battleground Ave
- 310 Campbell Cir
- 207 Morris St
- 110 N Gaston St
- 5066 Beargrass Dr
- 811 W Gold St Unit 26
- 311 E King St Unit 2
- 405 Clinton Dr
- 308 N Carpenter St
- 116 Walker St
- 312 Fulton St
- 300 Fulton St
- 109 Fulton St Unit 9
- 403 Cherry St
- 506 E Ridge St
- 308 W Mountain St
- 102 Savannahs Way
- 310 W Mountain St
- 100-1 Savannahs Way
- 107 S Tracy St
- 307 W Mountain St
- 305 W Mountain St
- 309 W Mountain St
- 105 S Tracy St
- 400 W Mountain St
- 311 W Mountain St
- 301 W Mountain St
- 402 W Mountain St
- 401 W Mountain St
- 102 S Tracy St
- 310 W Gold St
- 306 W Gold St Unit 10
- 306 W Gold St
- 211 W Mountain St
- 204 S Cansler St