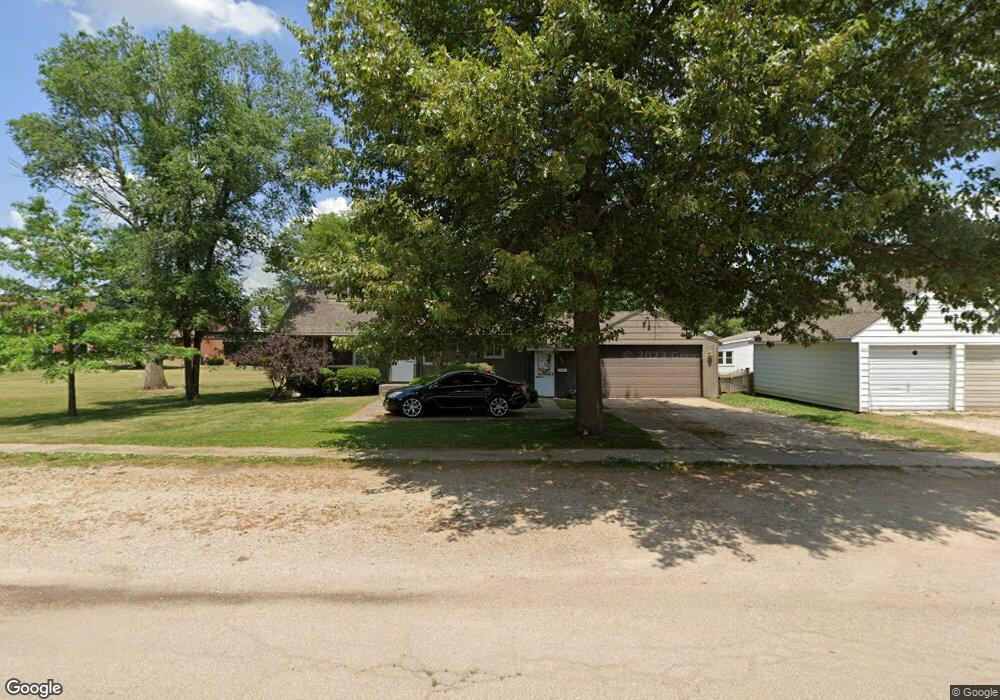
308 W Riverside Dr Prophetstown, IL 61277
Estimated Value: $127,000 - $158,000
3
Beds
2
Baths
998
Sq Ft
$144/Sq Ft
Est. Value
About This Home
This home is located at 308 W Riverside Dr, Prophetstown, IL 61277 and is currently estimated at $143,461, approximately $143 per square foot. 308 W Riverside Dr is a home located in Whiteside County with nearby schools including Prophetstown High School.
Ownership History
Date
Name
Owned For
Owner Type
Purchase Details
Closed on
Jan 11, 2013
Sold by
Roman Robert J and Roman Kent J
Bought by
Roman Terry J and Roman Wendy K
Current Estimated Value
Home Financials for this Owner
Home Financials are based on the most recent Mortgage that was taken out on this home.
Original Mortgage
$82,400
Interest Rate
3.3%
Mortgage Type
New Conventional
Purchase Details
Closed on
Nov 9, 2004
Sold by
Roman Robert J and Roman Juanita S
Bought by
Roman Kent J and Smith Kimber S
Create a Home Valuation Report for This Property
The Home Valuation Report is an in-depth analysis detailing your home's value as well as a comparison with similar homes in the area
Purchase History
| Date | Buyer | Sale Price | Title Company |
|---|---|---|---|
| Roman Terry J | $103,306 | None Available | |
| Roman Kent J | -- | None Available |
Source: Public Records
Mortgage History
| Date | Status | Borrower | Loan Amount |
|---|---|---|---|
| Closed | Roman Terry J | $82,400 |
Source: Public Records
Tax History
| Year | Tax Paid | Tax Assessment Tax Assessment Total Assessment is a certain percentage of the fair market value that is determined by local assessors to be the total taxable value of land and additions on the property. | Land | Improvement |
|---|---|---|---|---|
| 2024 | $3,031 | $41,585 | $3,753 | $37,832 |
| 2023 | $2,693 | $37,918 | $3,422 | $34,496 |
| 2022 | $2,372 | $33,394 | $3,014 | $30,380 |
| 2021 | $2,184 | $30,402 | $2,744 | $27,658 |
| 2020 | $2,238 | $30,338 | $2,738 | $27,600 |
| 2019 | $1,936 | $27,214 | $2,596 | $24,618 |
| 2018 | $2,003 | $28,224 | $2,692 | $25,532 |
| 2017 | $1,994 | $27,651 | $2,637 | $25,014 |
| 2016 | $1,970 | $26,706 | $2,547 | $24,159 |
| 2015 | $1,449 | $27,146 | $2,718 | $24,428 |
| 2014 | $1,830 | $25,927 | $2,596 | $23,331 |
| 2013 | $1,449 | $27,146 | $2,718 | $24,428 |
Source: Public Records
Map
Nearby Homes
- 45 Locust St
- 43 Meadow Ln
- 302 E 2nd St
- 501 Washington St
- 606 Locust St
- 705 W Commercial St
- 502 3rd St W
- 307 2nd St W
- 13240 Vandamme Rd
- 18521 Anderson Rd
- 15757 Black Blvd
- 000 Anderson Rd
- 20172 Prophet Rd
- 00 Lomax Rd
- 10015 Stichter St
- 8132 Matznick Rd
- 000 Banks Rd
- 0 Illinois 78
- 424 12th Avenue B
- 6753 Ellis Rd
Your Personal Tour Guide
Ask me questions while you tour the home.