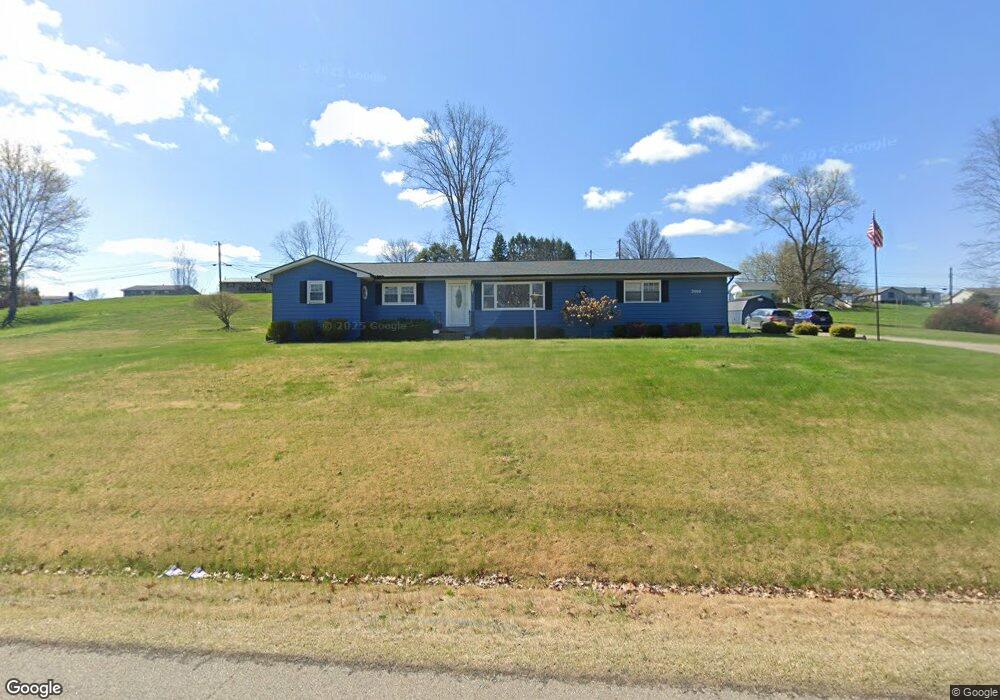
3080 Brookside Dr Zanesville, OH 43701
Estimated Value: $254,000 - $321,000
3
Beds
2
Baths
1,400
Sq Ft
$204/Sq Ft
Est. Value
About This Home
This home is located at 3080 Brookside Dr, Zanesville, OH 43701 and is currently estimated at $286,254, approximately $204 per square foot. 3080 Brookside Dr is a home located in Muskingum County with nearby schools including National Road Elementary School, Zanesville Middle School, and Zanesville High School.
Ownership History
Date
Name
Owned For
Owner Type
Purchase Details
Closed on
Sep 13, 2024
Sold by
Moyer Beau and Leigh Ann
Bought by
Beau And Leigh Ann Moyer Revocable Living Tru and Moyer
Current Estimated Value
Purchase Details
Closed on
Dec 27, 2016
Bought by
Beau Moyer
Home Financials for this Owner
Home Financials are based on the most recent Mortgage that was taken out on this home.
Interest Rate
4.3%
Purchase Details
Closed on
Sep 2, 2016
Bought by
Avendano Melanie Tr
Home Financials for this Owner
Home Financials are based on the most recent Mortgage that was taken out on this home.
Interest Rate
3.46%
Purchase Details
Closed on
Dec 7, 2010
Sold by
Wagner John W
Bought by
Wagner John W
Purchase Details
Closed on
Nov 12, 2003
Sold by
Wagner John W and Wagner Rita M
Bought by
Wagner John W and Wagner Rita M
Create a Home Valuation Report for This Property
The Home Valuation Report is an in-depth analysis detailing your home's value as well as a comparison with similar homes in the area
Home Values in the Area
Average Home Value in this Area
Purchase History
| Date | Buyer | Sale Price | Title Company |
|---|---|---|---|
| Beau And Leigh Ann Moyer Revocable Living Tru | -- | None Listed On Document | |
| Beau Moyer | $140,000 | -- | |
| Avendano Melanie Tr | -- | -- | |
| Wagner John W | -- | Attorney | |
| Wagner John W | -- | Attorney | |
| Wagner John W | -- | -- |
Source: Public Records
Mortgage History
| Date | Status | Borrower | Loan Amount |
|---|---|---|---|
| Previous Owner | Beau Moyer | -- | |
| Previous Owner | Beau Moyer | -- |
Source: Public Records
Tax History Compared to Growth
Tax History
| Year | Tax Paid | Tax Assessment Tax Assessment Total Assessment is a certain percentage of the fair market value that is determined by local assessors to be the total taxable value of land and additions on the property. | Land | Improvement |
|---|---|---|---|---|
| 2024 | $2,640 | $66,780 | $6,405 | $60,375 |
| 2023 | $2,155 | $50,610 | $5,880 | $44,730 |
| 2022 | $2,117 | $50,610 | $5,880 | $44,730 |
| 2021 | $2,099 | $50,610 | $5,880 | $44,730 |
| 2020 | $1,892 | $44,030 | $5,110 | $38,920 |
| 2019 | $1,891 | $44,030 | $5,110 | $38,920 |
| 2018 | $926 | $44,030 | $5,110 | $38,920 |
| 2017 | $1,135 | $35,035 | $5,110 | $29,925 |
| 2016 | $1,111 | $35,040 | $5,110 | $29,930 |
| 2015 | $1,111 | $35,040 | $5,110 | $29,930 |
| 2013 | $1,000 | $30,030 | $5,110 | $24,920 |
Source: Public Records
Map
Nearby Homes
- 240 Mockingbird Hill
- 2850 Watson Way
- 2425 S Pleasant Grove Rd
- 2870 Cody Dr
- 2755 N Lawndale Place
- 496 Pleasant Grove Rd
- 2465 Clay Pike
- 0 East Pike Unit 5163133
- 2397 Adamsville Rd
- 440 Stardust Cir
- 2230 Adamsville Rd
- 2383 Chandlersville Rd
- 1605 Jackson Rd
- 2835 Adamsville Rd
- 1636 Sharon Ave
- 360 Walters Way
- 365 Walters Way
- 330 Jordan Ave
- 27 Cemetery Ave
- 1345 Eastman St
- 3090 Brookside Dr
- 3075 Brookside Dr
- 3085 Primrose Dr
- 3085 Brookside Dr
- 3050 Brookside Dr
- 3095 Primrose Dr
- 3100 Brookside Dr
- 3065 Brookside Dr
- 3095 Brookside Dr
- 165 Anthony Ln
- 3105 Primrose Dr
- 3110 Brookside Dr
- 210 Anthony Ln
- 3105 Brookside Dr
- 3115 Primrose Dr
- 215 Anthony Ln
- 3090 Primrose Dr
- 3045 Brookside Dr
- 225 Anthony Ln
- 3125 Primrose Dr