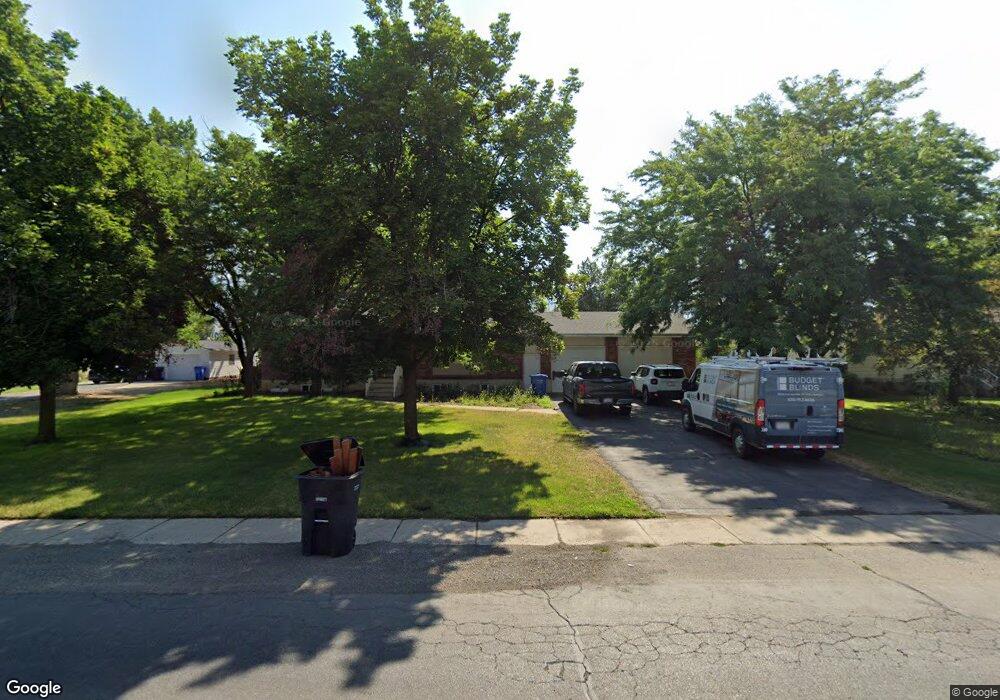
3080 S 800 W Nibley, UT 84321
Estimated Value: $417,000 - $470,000
4
Beds
1
Bath
2,288
Sq Ft
$189/Sq Ft
Est. Value
About This Home
This home is located at 3080 S 800 W, Nibley, UT 84321 and is currently estimated at $432,404, approximately $188 per square foot. 3080 S 800 W is a home located in Cache County with nearby schools including Nibley School, South Cache Middle School, and Spring Creek Middle School.
Ownership History
Date
Name
Owned For
Owner Type
Purchase Details
Closed on
Jun 30, 2020
Sold by
Mcbride John
Bought by
Mcbride John W and Mcbride Hayley A
Current Estimated Value
Purchase Details
Closed on
Jun 15, 2020
Sold by
Anderson Gloria P
Bought by
T Gary Anderson Investments Llc
Purchase Details
Closed on
Aug 14, 2017
Sold by
Anderson T Gary
Bought by
T Gary Anderson Investments Llc
Create a Home Valuation Report for This Property
The Home Valuation Report is an in-depth analysis detailing your home's value as well as a comparison with similar homes in the area
Home Values in the Area
Average Home Value in this Area
Purchase History
| Date | Buyer | Sale Price | Title Company |
|---|---|---|---|
| Mcbride John W | -- | American Secure Title Logan | |
| Mcbride John | -- | Cache Title Logan | |
| T Gary Anderson Investments Llc | -- | Cache Title Company | |
| T Gary Anderson Investments Llc | -- | Cache Title Logan | |
| T Gary Anderson Investments Llc | -- | None Available |
Source: Public Records
Tax History Compared to Growth
Tax History
| Year | Tax Paid | Tax Assessment Tax Assessment Total Assessment is a certain percentage of the fair market value that is determined by local assessors to be the total taxable value of land and additions on the property. | Land | Improvement |
|---|---|---|---|---|
| 2025 | $1,583 | $209,885 | $0 | $0 |
| 2024 | $1,679 | $208,950 | $0 | $0 |
| 2023 | $1,770 | $206,285 | $0 | $0 |
| 2022 | $1,843 | $206,290 | $0 | $0 |
| 2021 | $175 | $304,150 | $67,750 | $236,400 |
| 2020 | $1,593 | $263,650 | $66,650 | $197,000 |
| 2019 | $1,412 | $222,863 | $66,650 | $156,213 |
| 2018 | $1,134 | $174,544 | $42,160 | $132,384 |
| 2017 | $1,081 | $88,200 | $0 | $0 |
| 2016 | $1,093 | $87,945 | $0 | $0 |
| 2015 | $1,083 | $87,945 | $0 | $0 |
| 2014 | $970 | $80,560 | $0 | $0 |
| 2013 | -- | $83,315 | $0 | $0 |
Source: Public Records
Map
Nearby Homes