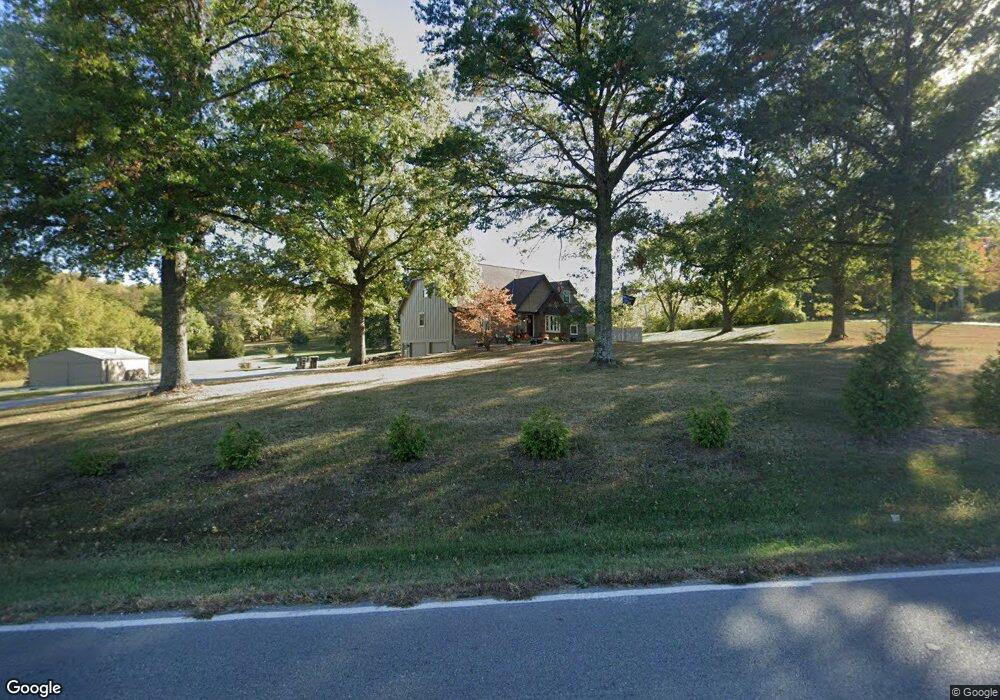
30805 Duncan Rd Grain Valley, MO 64029
Estimated Value: $476,000 - $622,000
4
Beds
4
Baths
2,066
Sq Ft
$268/Sq Ft
Est. Value
About This Home
This home is located at 30805 Duncan Rd, Grain Valley, MO 64029 and is currently estimated at $554,170, approximately $268 per square foot. 30805 Duncan Rd is a home located in Jackson County with nearby schools including Grain Valley High School.
Ownership History
Date
Name
Owned For
Owner Type
Purchase Details
Closed on
Mar 14, 2022
Sold by
Piedimonte Robert W and Piedimonte Sandra K
Bought by
Dowding Brian and Dowding Emily
Current Estimated Value
Purchase Details
Closed on
Jul 29, 2020
Sold by
Duncan Troy W and Duncan Robin L
Bought by
Wesley Samantha and Wesley Logan
Home Financials for this Owner
Home Financials are based on the most recent Mortgage that was taken out on this home.
Original Mortgage
$307,500
Interest Rate
3.1%
Mortgage Type
New Conventional
Purchase Details
Closed on
Jun 29, 2006
Sold by
Revocabl Ronchetto Dorothy Ann
Bought by
Duncan Troy W and Duncan Robin L
Home Financials for this Owner
Home Financials are based on the most recent Mortgage that was taken out on this home.
Original Mortgage
$253,000
Interest Rate
6.63%
Mortgage Type
Purchase Money Mortgage
Purchase Details
Closed on
Sep 26, 2005
Sold by
Ronchetto Dorothy A
Bought by
Revocabl Ronchetto Dorothy Ann and Dorothy Ann Ronchetto Revocable Trust
Create a Home Valuation Report for This Property
The Home Valuation Report is an in-depth analysis detailing your home's value as well as a comparison with similar homes in the area
Home Values in the Area
Average Home Value in this Area
Purchase History
| Date | Buyer | Sale Price | Title Company |
|---|---|---|---|
| Dowding Brian | -- | Secured Title | |
| Dowding Brian | -- | Secured Title | |
| Wesley Samantha | -- | Kansas City Title Inc | |
| Duncan Troy W | -- | Kansas City Title | |
| Revocabl Ronchetto Dorothy Ann | -- | -- |
Source: Public Records
Mortgage History
| Date | Status | Borrower | Loan Amount |
|---|---|---|---|
| Previous Owner | Wesley Samantha | $307,500 | |
| Previous Owner | Duncan Troy W | $253,000 |
Source: Public Records
Tax History Compared to Growth
Tax History
| Year | Tax Paid | Tax Assessment Tax Assessment Total Assessment is a certain percentage of the fair market value that is determined by local assessors to be the total taxable value of land and additions on the property. | Land | Improvement |
|---|---|---|---|---|
| 2025 | $6,238 | $58,043 | $11,643 | $46,400 |
| 2024 | $6,238 | $87,265 | $21,970 | $65,295 |
| 2023 | $5,978 | $87,265 | $18,447 | $68,818 |
| 2022 | $3,343 | $43,890 | $6,954 | $36,936 |
| 2021 | $3,249 | $43,890 | $6,954 | $36,936 |
| 2020 | $2,837 | $38,461 | $6,954 | $31,507 |
| 2019 | $2,767 | $38,461 | $6,954 | $31,507 |
| 2018 | $2,900 | $37,754 | $13,987 | $23,767 |
| 2017 | $2,900 | $37,754 | $13,987 | $23,767 |
| 2016 | $2,825 | $36,808 | $9,080 | $27,728 |
| 2014 | $2,849 | $36,808 | $9,080 | $27,728 |
Source: Public Records
Map
Nearby Homes
- 1515 NW Whispering Ct
- 1310 NW Sycamore Dr
- 1403 NW Burr Oak Ct
- 2003 NW Elmwood Dr
- 816 NW Cedar Ln
- 1103 NW Hickory Ct
- 952 NW Maplewood Ct
- 2211 NW Hedgewood Dr
- 2210 NE Treetop Dr
- 1702 NW Hedgewood Dr
- 804 NW Hickory Ridge Dr
- 2104 NE Wyndham Place
- 2304 NE 23rd St
- 809 NW Poplar Ct
- 803 NW Hickory Ridge Dr
- 801 NW Hickory Ridge Dr
- 2309 NE 23rd St
- 1601 NW Nicholas Dr
- 2237 NE Maybrook Dr
- 408 NW Rust Ct
- 30805 E Duncan Rd
- 4310 Tyer Rd
- 30706 E Duncan Rd
- 4401 Tyer Rd
- 4320 Tyer Rd
- 4324 S Meadow Ln
- 4310 S Meadow Ln
- 30612 E Duncan Rd
- 2713 NE Wheatley Dr
- 2708 NE Wheatley Dr
- 2339 NE Skopelas Ct
- 2712 NE Wheatley Dr
- 4407 Tyer Rd
- 4309 S Meadow Ln
- 4404 Tyer Rd
- 4406 S Meadow Ln
- 1509 NW Pond Ave
- 4115 Tyer Rd
- 30604 E Duncan Rd
- 1511 NW Pond Ave